The Reports platform is capable of producing an extensive array of reports tailored for your organisation. These reports encompass various aspects of an organisations performance and inventory management, providing valuable insights for decision-making.
Each report can be customised to fit the unique needs and objectives of your organisation, providing key metrics and actionable insights to support strategic planning and operational efficiency.
To utilise the Sapphire Custom Web Pack Reports, follow these steps:
- Navigate into “Reports”.
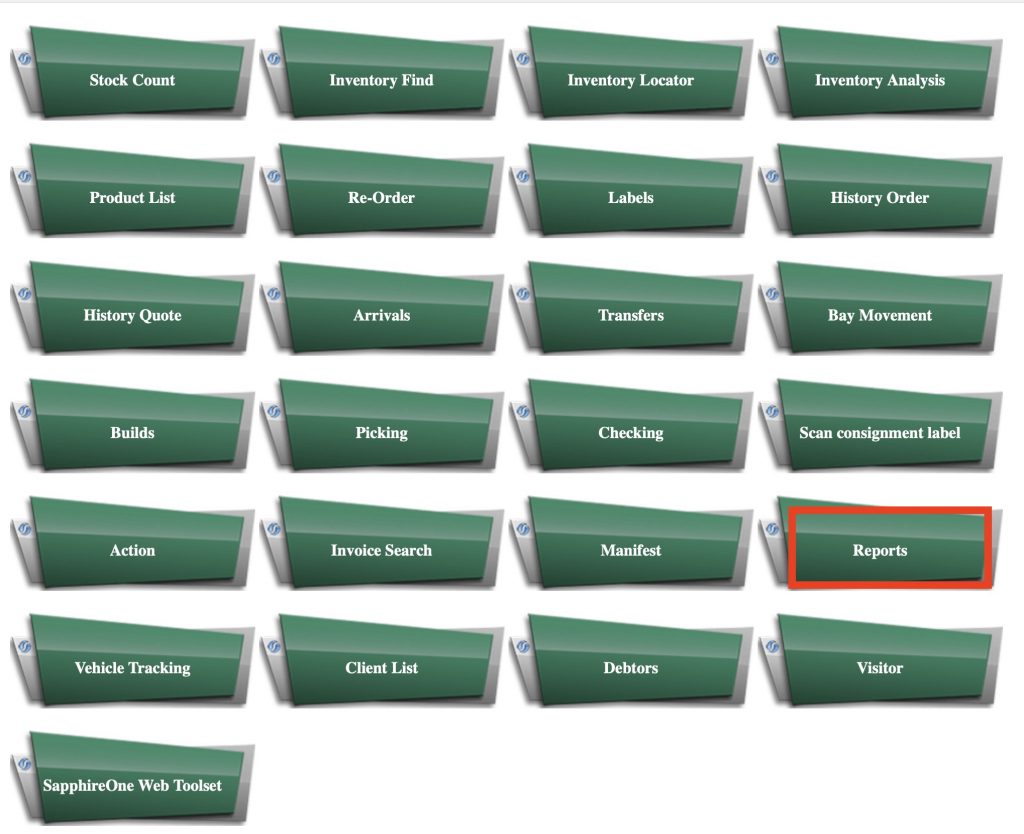
- Once entered, the following page will appear with these reports:
- Daily Margins
- Negative Stock
- Vendor Stock
- Quarterly Sales
- Yearly Sales by Quarter
- YTD Sales
- Quarterly Product Margin
- Yearly Product Margin
- Sales by Month
- Cumulative Sales by Month
- Sales by Rep Product Volume
- YTD Summary
- Builds
- Product Tracker
- Batch Search
- Sales by Delivery Date
- Current Position
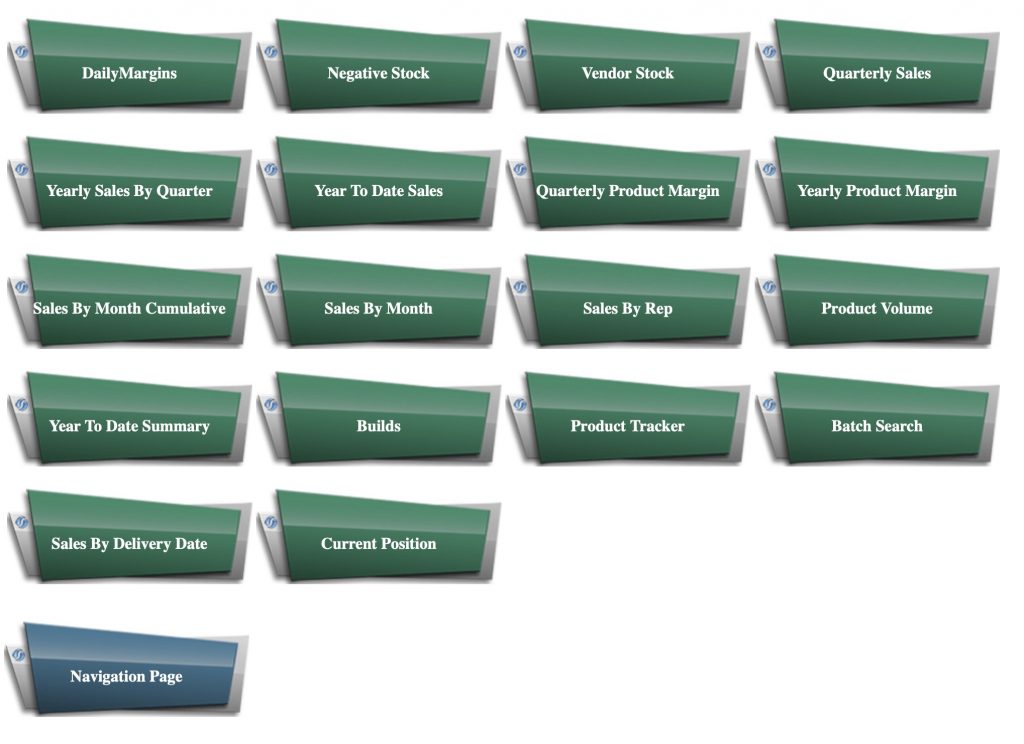
Please note: The reports displayed on this page are solely for illustrative purposes; as a result, the information within them has been redacted or obscured.
Daily Margins Report
This report offers a daily overview of profitability margins, helping you understand which products or services are most and/or least profitable.

Negative Stock Report
This report identifies inventory items that have fallen below the minimum stock level, which could indicate potential stock-outs or inventory management issues.

Vendor Stock Report
This report keeps track of the stock levels for each vendor, allowing you to monitor supplier performance and manage reordering processes effectively.

Quarterly Sales Report
A breakdown of sales figures for each quarter, giving you insight into sales trends and performance over three-month periods.

Yearly Sales by Quarter Report
This report provides an annual overview of sales, broken down by individual quarters, to compare performance across different parts of the year.

Year-To-Date (YTD) Sales Reports
This report tracks total sales from the beginning of the fiscal year to the current date, helping your organisation to gauge its annual performance.

Quarterly Product Margin Reports
This report analyses the profit margins on products sold during each quarter, which can inform pricing strategies and inventory development.

Yearly Product Margin Reports
Similar to the quarterly report, this version offers a yearly perspective on product margins, enabling long-term profitability analysis.
By Quarter

By Year

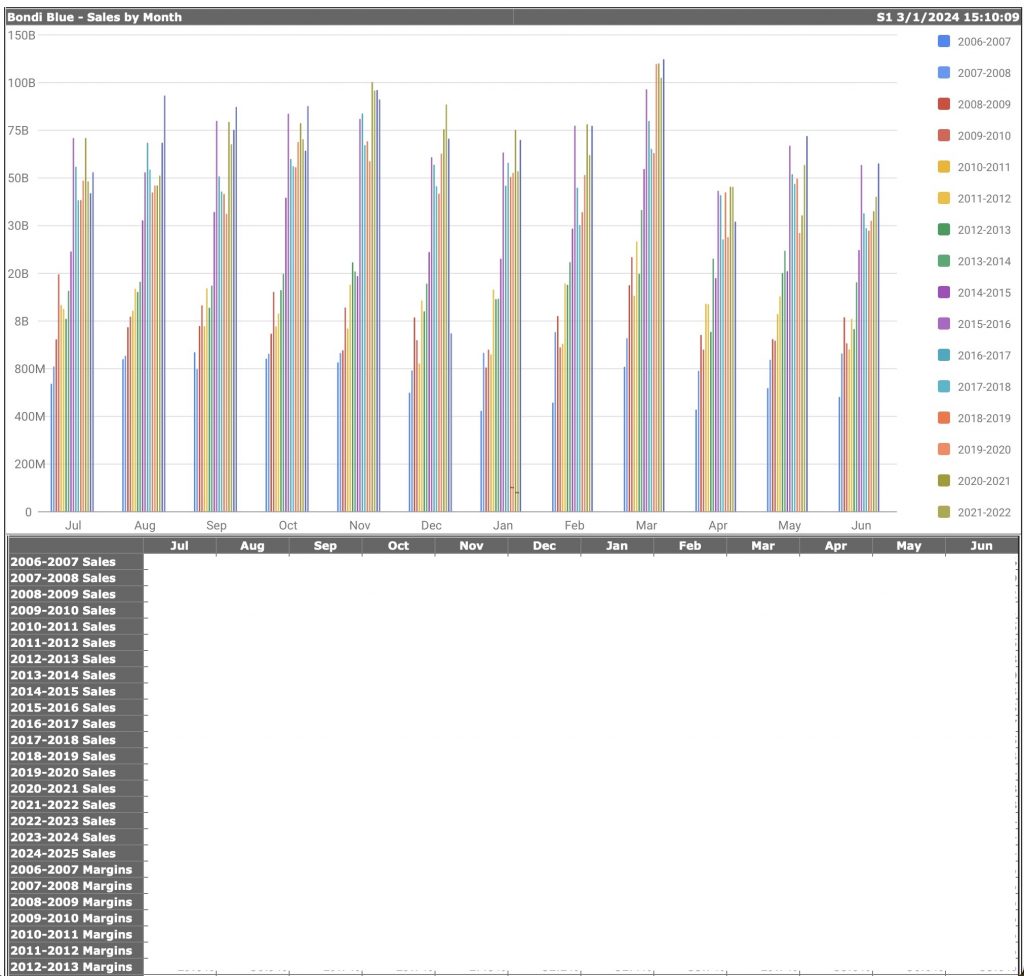
Sales by Month Reports & Cumulative Sales by Month Reports
Sales by Month Report: A detailed account of sales achieved in each month, which can highlight seasonal trends and monthly performance.
Cumulative Sales by Month Report: This report adds up sales cumulatively over the months, showing growth and helping to identify any sales plateaus or declines.
Sales by Rep Reports
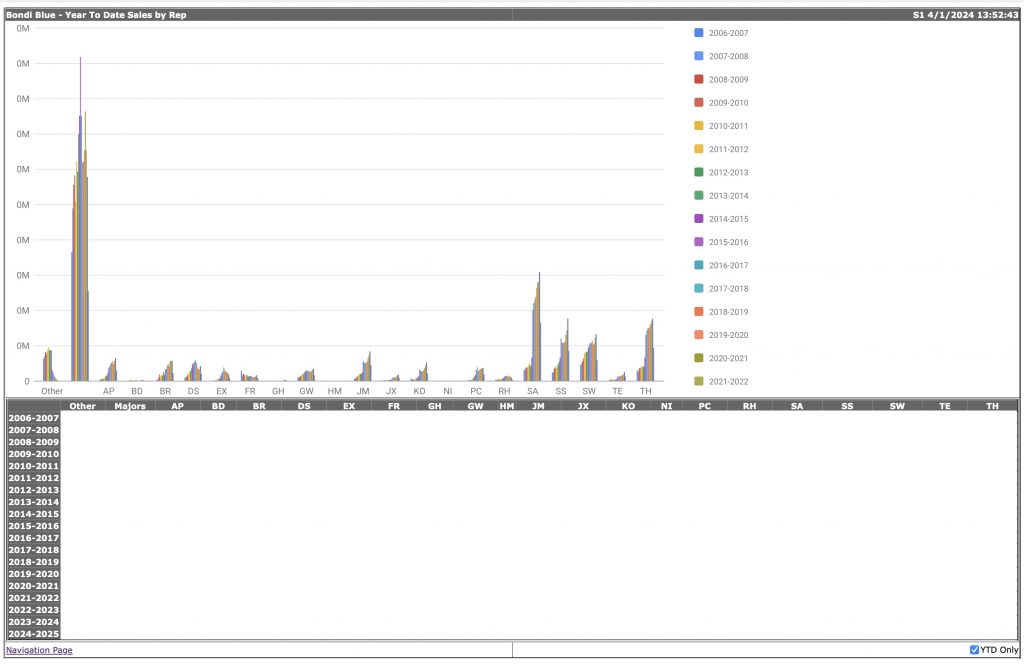
A performance report for each sales representative, showcasing their individual sales figures and contributions to the company’s revenue.
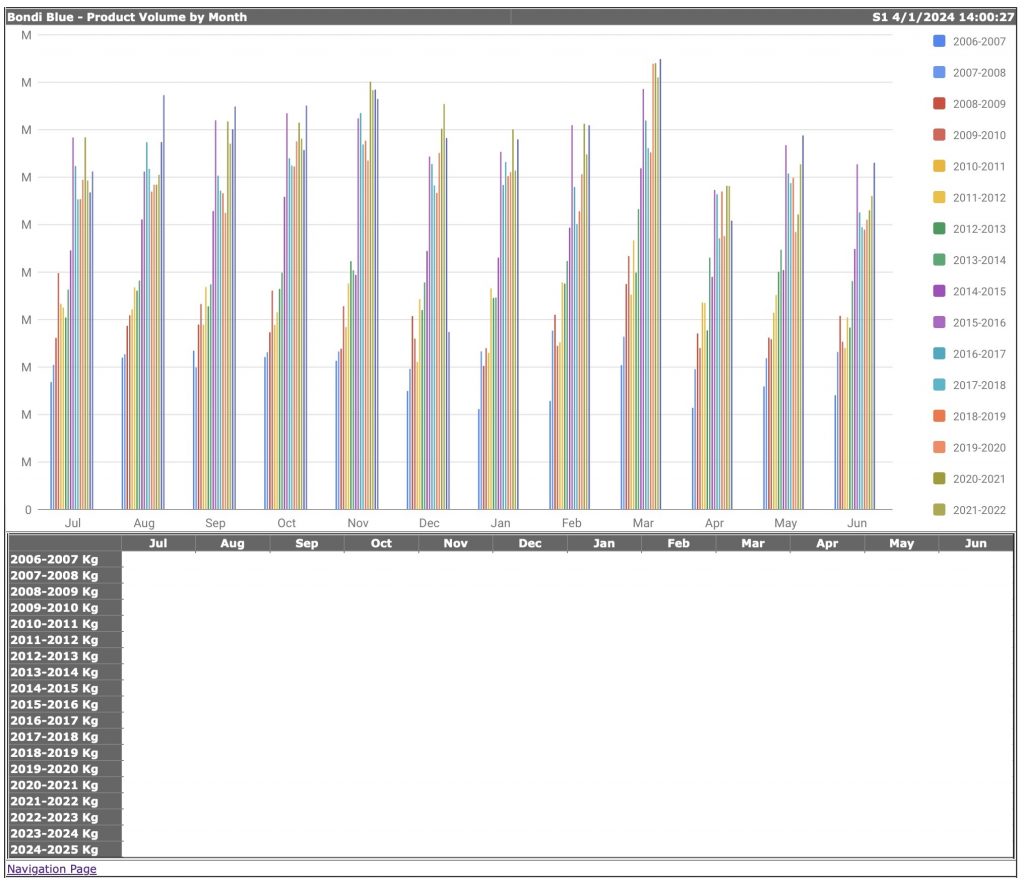
Product Volume YTD Summary Reports
This summary provides an overview of the quantities of each product sold year-to-date, which will be crucial for inventory planning and forecasting.
Builds and Product Tracker Reports
Reports that tracks the status and progress of product builds, from inception through to completion.

Batch Search Reports
Allows you to search and analyse batch-level data to ensure quality control and traceability within your supply chain.
- Limit results to Period 1–30 – Active by default. This feature may be beneficial for performance if historical records are significant.

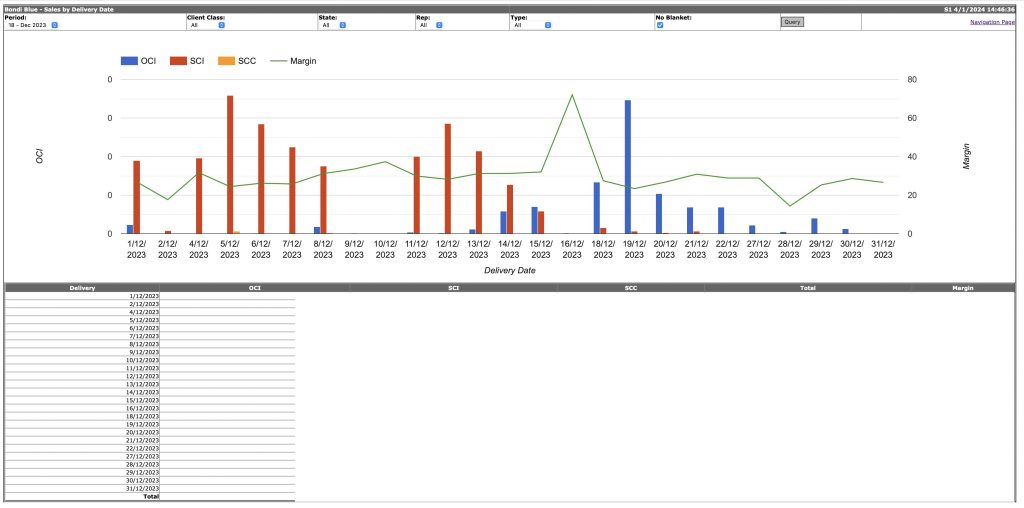
Sales by Delivery Date Reports
A report that aligns sales data with delivery dates, offering insights into the fulfilment and logistics efficiency of your operations.
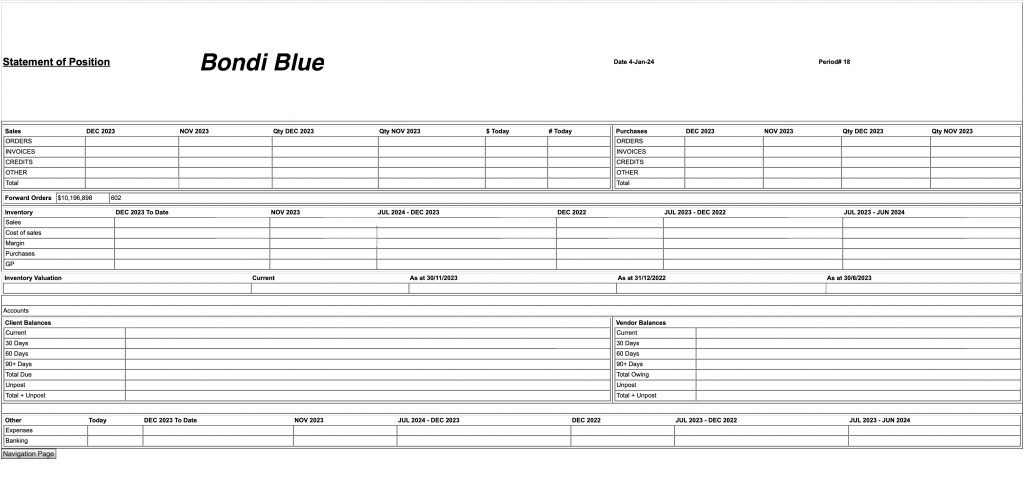
Current Position Reports
This provides a real-time snapshot of your company’s financial and inventory position, helping to make immediate decisions based on the most current data.
You can review our Blog and YouTube channel for additional information and resources on SapphireOne ERP, CRM and Business Accounting software.