SapphireOne Information Report Overview
The SapphireOne Information Report file can assist with troubleshooting performance bottlenecks. This file is dynamically generated on your server and, by default, is refreshed at five-minute intervals. It begins to overwrite older files after 28 days. When prudent, SapphireOne may request a client’s SapphireOne Information Report from the ‘Folder_reports’ directory, which is located in the root directory of your SapphireOne server files, to assist in resolving performance issues.
The following article, provided by 4D Software, is transcribed here verbatim. This is to enable our clients to understand the capabilities of the functionality available to SapphireOne in resolving performance issues.
Presentation
This information component is mainly designed to provide in readable text documents a description of:
- The computer (Hardware / Operating system)
- The version of the 4D Application
- The Host database settings (and tables summary)
- Supported version of 4D (component updated in v4.60):
- 4D v20 version (up to v20 R2 and next R version when available)
- 4D v19 version (up to v19 R5),
- 4D v19 R6 version (also for later versions)
- 4D v18 version (v18.x up to v18 R6)
- Archives of older versions :
- For 4D v17: version v4.33,
- For 4D v16: version v4.9rZC rev3, for 4D v15: version v4.9rZ8 rev2,
- For 4D v14: version v4.9rZ2 rev1, for 4D v13: version v4.9rZ2 rev1,
- For 4D v13: version v4.9rZ2 rev1, for 4D v12: version v4.9rZ
All versions of the component can handle reports created using 4D v20, v19, v18, v17, v16, 4D v15, 4D v14, 4D v13, 4D v12, with English or French description.
Some information about this component:
- It does not require or use plug-in or another component (including 4D SVG).
- It can be used with any Host database or as a stand-alone starting with 4D v18 (LTS or FR). (it will ask for an initial creation of a data file when used stand-alone).
- This component does not create or use table / record in the Host database (or in an external DB).
Confidentiality:
- The component does not access or share any record content, resource content, etc…
- It will only describe some basic elements of the structure (number and name of the tables, number of fields or indexes (but not their name or their type), and the number of records for each table. (optional parameter values let you hide some details).
- It will get some details on the computer and operating system, and the path names used for the database and the application.
Compatibility:
4D_Info_Report_v4 can handle reports created by aa4D_Report (since v3- 2011), with French or English content (the two possible languages used in the reports).
Supported language for the interface and the content of the reports):
(based on the release of 4D used: in French with a French release of 4D, otherwise in English. Now the menu bar of the dialogs matches other versions (except Japanese))
Supported platform, O.S., processor:
All Operating systems compatible with 4D, Intel/AMD processors, Apple Silicon native (v19 and v20)
Naming convention:
Name of the component:
The name of the component is «4D_Info_Report_v4» since March 2014.
(«_v4» is for all v4.x versions, and will be replaced by “4D_Info_Report_v5” later).
The name of the currently provided v4.60 zip archives is completed with some details:
- 4D_Info_Report_v4.60_v20_I.zip (I= built for Intel(+AMD) only)
- 4D_Info_Report_v4.60_v20_IS.zip (IS = built for Intel+AMD+Silicon)
- 4D_Info_Report_v4.60_v19R6_I.zip (I= built for Intel(+AMD) only)
- 4D_Info_Report_v4.60_v19R6_IS.zip (IS = built for Intel+AMD+Silicon)
- 4D_Info_Report_v4.60_v19_I.zip (I= built for Intel(+AMD) only)
- 4D_Info_Report_v4.60_v19_IS.zip (IS = built for Intel+AMD+Silicon)
- 4D_Info_Report_v4.60_v18.zip (built for Intel(+AMD), or Rosetta (under Silicon)).
Older versions archive ends with the corresponding 4D version: «_v12» to «_v18»
- Name of the shared methods (not changed for historical reasons)
- The name of the shared methods always begins with «aa4D_».
- Name of the created processes or worker: always begins with «4DIReport_»
List of the historic shared methods of the component: (by category)
Creation of reports:
- aa4D_M_CreateReport_faceless
- aa4D_NP_Util_CreateReport
- aa4D_NP_Util_CreateReport_Serv
- aa4D_M_Report_CreateOnServerSee
- aa4D_NP_Schedule_Reports_Server
Display of existing reports:
- aa4D_NP_Get_Last_Server_Report
Display of dialogs:
- aa4D_NP_Report_Analyse_Display
- aa4D_NP_Report_Compare_Display
- aa4D_NP_Report_Manage_Display
- aa4D_NP_Report_Export_Display
Utility: (* = invisible shared methods)
- aa4D_M_Get_Build_4D_Text_Call
- aa4D_M_Folder_Rep_SetPath_local *
- aa4D_M_Folder_Rep_GetPath_local *
- aa4D_M_Get_Component_Version
- aa4D_M_Get_Expiration_Date (deprecated)
- aa4D_M_Get_Information_Text
- aa4D_M_Show_Preferences *
- aa4D_NP_Reports_Max_Set_Limit *
- aa4D_NP_Reports_Max_Get_Limit *
- aa4D_NP_Agent_Schedule_Call *
- aa4D_M_Agent_Get_Records_Call *
Details on the shared methods of the component:
aa4D_M_CreateReport_faceless
aa4D_M_CreateReport_faceless ({ContentMode}; {CommentPointer}; {Nb processes list})
| Parameter | Type | Description |
| ContentMode | Longint | Define the mode of the description of report (for tables) Default is to describe all if this parameter is omitted |
| CommentPointer | Pointer | Pointer to a text from the Host DB to be included in the report |
| Nb processes list | Longint | Define the number of processes to list in the report |
Description
The aa4D_M_CreateReport_faceless command allows you to create a report within the current process of your Host database. It was mainly designed as a tool to debug your code, when you need for example to get details on the memory and cache usage at a particular condition, or when repeating in a loop a part of your code to detect memory leaks. (it is usual to hide the Table list via the ContentMode parameter in this case).
aa4D_M_Get_Build_4D_Text_call
aa4D_M_Get_Build_4D_Text_call ({ContentPointer}; { PathPointer})
| Parameter | Type | Description |
| ContentPointer | Pointer | Pointer to a text variable to complete with result |
| PathPointer | Pointer | Pointer to a text variable containing the full path of the file. |
Description
The aa4D_M_Get_Build_4D_Text_call command allows you to display (or retrieve) the detail of the version and build number of an executable or a plug-in. It works cross-platform, meaning that you can get the build number of an executable file on MacOS, or parse the «Info.plist» of a Mac Application on Windows. (When you parse a file that contains a «/contents/info.plist», this is the file to select in the dialog to retrieve the information). If no parameter is passed, a dialog to select the file is displayed, and the result is displayed in an Alert. If you pass a pointer to a text variable as a first parameter, the content of the Alert will be redirected to the pointed text variable.
If you pass a pointer to a text variable as a second parameter, the pointed text variable must contain the full pathname of the file to be examined.
aa4D_NP_Get_Last_Server_Report
aa4D_NP_Get_Last_Server_Report ({Report_Name_p}; {Report_Content_p})
| Parameter | Type | Description |
| Report_Name_p | Pointer | Pointer to a text to retrieve the name of the report |
| Report_Content_p | Pointer | Pointer to a text to retrieve the content of the report |
Description
The aa4D_NP_Get_Last_Server_Report command allows you to retrieve the last report created in the Folder reports of the database, even from 4D Remote.
Without parameter, it will display it’s content in a dialog. You can then save it in your computer.
(if run in Local mode, it will retrieve the last report of your application).
aa4D_M_Report_CreateOnServerSee
aa4D_M_Report_CreateOnServerSee ({ContentMode}; {CommentPointer}; {Nb processes list})
| Parameter | Type | Description |
| ContentMode | Longint | Define the mode of the description of report (for tables) Default is to describe all if this parameter is omitted |
| CommentPointer | Pointer | Pointer to a text from the Host DB to be included in the report |
| Nb processes list | Longint | Define the number of processes to list in the report |
Description
The aa4D_M_Report_CreateOnServerSee command allows you to create a report on the Server, and after a small wait, retrieve the last created report from 4D Server, and display it in the same dialog as when creating a report in Local mode: But from there, you will be able to save it locally.
(If no previous report was created on the Server, this command might miss the last created report and retrieve the previous one. This is because the first report created after the Startup of the application is doing more processing than for later reports, completing a small document named “Array_profiler.json”.
In this case, just execute “aa4D_NP_Get_Last_Server_Report” to be sure to retrieve the last created report.)
aa4D_NP_Report_Analyse_Display
aa4D_NP_Report_Analyse_Display ({Report name or Full path}; {ReportContent})
| Parameter | Type | Description |
| Report name or Full path | Text | Name of the report or full path name of the report |
| ReportContent | Text | Text content of the corresponding report |
Description
The aa4D aa4D_NP_Report_Analyse_Display command allows you to display a dialog that let you compare the (last created) report with an earlier one (or a later one), and see for example the variation of records in each table (by value and percentage), to get an idea of what is moving most.
If you pass a Full path in $1, the Report will be directly parsed to retrieve it’s content.
If you pass the Report Content in $2, the content will be parsed without opening the report file.
aa4D_NP_Report_Compare_Display
Description
The aa4D_NP_Report_Compare_Display command allows you to display a dialog with a List box that let you open a local folder of reports to compare the main usage (Number of users, Process, etc..) and main memory and cache evolutions.
From this dialog, you can export the results in an external document, including Excel.
You can also display a new dialog with a SVG graph.
This is the main dialog to analyse external reports. (see some details later in the documentation).
aa4D_NP_Report_Manage_Display (secured)
aa4D_NP_Report_Manage_Display
Description
The aa4D_NP_Report_Manage_Display command allows you to display a dialog to upload reports (or a selection of reports) from 4D Server, and copy them to a local folder.
You can also set (start and stop) via the dialog the stored procedure that creates reports on 4D Server.
(same as if executing aa4D_NP_Schedule_Reports_Server).
aa4D_NP_Report_Export_Display (secured)
aa4D_NP_Report_Export_Display
Description
The aa4D_NP_Report_Esport_Display command allows you to display a dialog to select the reports to parse from 4D Server and display them in the same dialog as the Compare Display, with simple criteria expressed in Day(s) or number of last reports.
You can also via this dialog:
- Display the last report that was created (by 4D Server if on Remote mode)
- Display the dialog of the Manage Display via a button “Manage…”
This shared method is very convenient to access via a specific new Menu item of your application all the main features of 4D_Info_Report, for example via a Remote application.
aa4D_NP_Schedule_Reports_Server (secured)
aa4D_NP_Schedule_Reports_Server ({DelayBetween}; {ContentMode}; {CommentPointer}; {Nb processes list})
| Parameter | Type | Description |
| DelayBetween | Real | Define in minute(s) the delay between two reports |
| ContentMode | Longint | Define the mode of the description of report (for tables) Default is to describe all if this parameter is omitted |
| CommentPointer | Pointer | Pointer to a text from the Host DB to be included in the report |
| Nb processes list | Longint | Define the number of processes to list in the report |
Description
The aa4D_NP_Schedule_Reports_Server command allows you to manage a Stored procedure on 4D Server, that will create a new report every N minutes (or tenth of minutes if <1), so you keep a trace of the usage of your 4D Server.
Later on, you can check the evolution of this usage by parsing the reports via the Compare dialog (called by the shared method: aa4D_NP_Report_Compare_Display)
If you pass no parameter, the default value of 5 minutes will be used.
To stop the stored procedure, just pass 0 as the first parameter when calling this method.
aa4D_NP_Util_CreateReport
aa4D_NP_Util_CreateReport ({FacelessMode}; {ContentMode}; {CommentPointer}; {Nb processes list})
| Parameter | Type | Description |
| FacelessMode | Longint | If >0, hide the dialog after creating the report. |
| ContentMode | Longint | Define the mode of the description of report (for tables) Default is to describe all if this parameter is omitted |
| CommentPointer | Pointer | Pointer to a text from the Host DB to be included in the report |
| Nb processes list* | Longint | Define the number of processes to list in the report |
Description
The aa4D_NP_Util_CreateReport command is the main command of this component:
This is the one you will ask your customers to use when you need to get a picture of the configuration, settings and volume of the database.
If you ask to execute it on 4D Server, there will be no dialog indicating when it is done, but waiting for a few minutes will let you be sure that the report was created on the Server.
If executed in Local Mode or running Stand-Alone, a dialog will be displayed with the content of the report: from this dialog, you will be able to access the created text file(s).
The first time a report is created:
- A folder named “Folder_reports” will be created next to the Data file (if it does not exist)
- Some Launch External process will parse some information about the computer
- A document “Array_profiler.json” will be created in the “Folder_reports”, with some constant values retrieved (only the first time after starting the 4D Application).
(See a large report content example later in the documentation).
Please pay some attention at the Attention section of the report: we try to remind here what should be noticed (and in some case changed).
Note: Nb processes list*: pass -1 for all tasks (up to the last 4000 current active ones).
aa4D_NP_Util_CreateReport_Serv
aa4D_NP_Util_CreateReport_Serv ({FacelessMode}; {ContentMode}; {CommentPointer}; {Nb processes list})
| Parameter | Type | Description |
| FacelessMode | Longint | If >0, hide the dialog after creating the report. |
| ContentMode | Longint | Define the mode of the description of report (for tables) Default is to describe all if this parameter is omitted |
| CommentPointer | Pointer | Pointer to a text from the Host DB to be included in the report |
| Nb processes list | Longint | Define the number of processes to list in the report |
Description
The aa4D_NP_Util_CreateReport_Serv command is very similar to the aa4D_NP_Util_CreateReport command.
The only difference is that it will create the report on 4D Server when executed in Remote application.
Note: In a Server / Remote configuration, no dialog will display on 4D Server when executed.
aa4D_M_Folder_Rep_SetPath_local (invisible / secured)
aa4D_M_Folder_Rep_SetPath_local (vp_FolderNewPath)
| Parameter | Type | Description |
| vp_FolderNewPath | Pointer | Point to the text variable containing the Full pathname of the new «Folder_reports» to be used. After modifying the « Folder_reports » location, $1-> will contain the new Full pathname |
| Vb_OK | Boolean | No error was detected for this operation: $0=True. |
Description
The aa4D_M_Folder_Rep_SetPath_local function let you set a new location for the «Folder_Reports».
(instead of its default location next to the Data file).
This method must be called after each restart of the Host database to not use the default location.
Example Host method code to use this shared method:
// Method: aa4D_M_Host_Set_folder_Path
// Use the shared (but invisible) method «aa4D_M_Folder_Rep_SetPath_local»
// of the component 4D_Info_Report
C_TEXT($vt_Folder_Pathname)
ARRAY TEXT($at_Components;0)
COMPONENT LIST($at_Components)
If (Find in array($at_Components;»4D_Info_Report@»)>0) // the component is loaded
// ************* TO BE CUSTOMIZED ********************
// set a path for the folder to create or select(on Windows in this example):
$vt_Folder_Pathname:=«C:\\Component Testing\\Subfolder\\Another folder\\»
// ---- set the new pathname for future reports ------
EXECUTE METHOD(«aa4D_M_Folder_Rep_SetPath_local»;$vb_FolderPath_OK;->$vt_Folder_Pathname)
// Keep this path if you need to check it's content or reuse it later.
// ----to Test the creation of a report in this Folder Pathname-----
If (Test path name($vt_Folder_Pathname)=0) // if this folder exists
CONFIRM(«Create a report in this Local folder?\n»+$vt_Folder_Pathname)
If (OK=1)
EXECUTE METHOD(«aa4D_NP_Util_CreateReport»;*;1)
End if
End if
// ------ verify the changed pathname of the folder ----
EXECUTE METHOD(«aa4D_M_Folder_Rep_GetPath_local»;$vb_FolderPath_OK;->$vt_Folder_Pathname)
// $vt_Folder_Pathname must correspond.
End if
aa4D_M_Folder_Rep_GetPath_local (invisible / secured)
aa4D_M_Folder_Rep_GetPath_local (vp_FolderPath)
| Parameter | Type | Description |
| vp_ FolderPath | Pointer | Point to the text variable that will get the Full pathname of the current «Folder_reports». $1-> will contain the current Full pathname |
| Vb_OK | Boolean | No error was detected for this operation: $0=True. |
Description
The aa4D_M_Folder_Rep_GetPath_local function let you get the current location of «Folder_Reports».
(it’s default location is next to the Data file. if the Folder_Reports did not exist, it will be created).
aa4D_M_Get_Component_Version
aa4D_M_Get_Component_Version (vp_TextResult)
| Parameter | Type | Description |
| vp_TextResult | Pointer | Pointer to the text variable (or field) to get the result. |
Description
The aa4D_M_Get_Component_Version function let you get the current version of the component 4D_Info_Report_v4 more explicit name.
Example of content in the pointed variable after executing this shared method: « 4.60 (2023-09-21)».
If the method is called without parameter, the version will be displayed in an ALERT.
aa4D_M_Get_Component_Version_t (New in v4.60, preemptive, invisible)
aa4D_M_Get_Component_Version_t
| Result | Type | Description |
| vt_TextResult | Text | text with the version |
Description
The aa4D_M_Get_Component_Version_t function let you get the current version of the component 4D_Info_Report_v4 more explicit name.
Example of content of the returned text value, after executing this shared method: « 4.60 (2023-09-21)».
aa4D_M_Get_Information_Text
aa4D_M_Get_Information_Text (vt_Selector;vp_TextResult)
| Parameter | Type | Description |
| vt_Selector | Text | Selector for the kind of expected result (explicit or number) |
| vp_TextResult | Pointer | Pointer to the text variable (or field) to get the result. |
Description
The aa4D_M_Get_Information_Text function let you get the current text value depending of the selector. vt_Selector is a text parameter: il can contains either the string of a numeric integer, or a more explicit name. (if no Array_profiler.json & report were created, these results remains available).
(these text results are provided from 4D Server if called from 4D Remote).
| «Array_Profiler» | or«0» | Get the content of the Array_profiler.json |
| «Manufacturer» | or«1» | Get the Manufacturer in the Array_profiler.json |
| «Model Identifier» | or«2» | Get the Model Identifier in the Array_profiler.json |
| «Memory» | or«3» | Get the RAM value (MB) in the Array_profiler.json |
| «System» | or«4» | Get the System description in the Array_profiler.json |
| «Nb Processors» | or«5» | Get the Number of Processors in the Array_profiler.json |
| «Processor Name» | or«6» | Get the Processor Name in the Array_profiler.json |
| «CPU Speed» | or«7» | Get the CPU Speed in the Array_profiler.json |
| «Total Nb Cores» | or«8» | Get the Total number of Cores in the Array_profiler.json |
| «Nb CPU threads» | or«9» | Get the Total number of CPU threads in the Array_profiler.json |
| «System Web Browser» | or«10» | Get the Default System Web Browser in the Array_profiler.json |
| «4D Internal Build» | or«11» | Get the version and build of 4D in the Array_profiler.json |
| «More infos 4D release» | or«12» | Get More info on 4D (if available) in the Array_profiler.json |
| «Memory modules» | or«13» | Get the description of the Memory modules |
| «Disk» | or«14» | Get the description of the Disk |
| «Volume» | or«15» | Get the description of the Volume |
| «Disk & Volume» | or«16» | Get the description of Disk and Volume |
| «Plugin_List» | or«17» | Get the list of Plugin versions |
| «Component_List» | or«18» | Get the list of Component versions |
| «MainUUID» | or«19» | Get the Data file Main UUID |
| «Cache Settings» | or«20» | Get the Cache settings (new in v4.5) |
| «Scheduler_SP_Minutes» | or«21» | Get the number of minutes set for the stored procedure ( = 0 when run in stand-alone. new in v4.7) |
| «Agent_SP_Seconds» | or«22» | Get the number of minutes set for the stored procedure That returns JSON results (=0 when run in stand-alone) |
| «Attention_file» | or«23» | Get the text content of the Attention_report.txt file. |
| “Cache_Memory_value | or«24» | Get info on the Cache |
| “IPv4” | or«25» | Get the IPv4 and Web Server port of 4D Server |
| “PID” | or«26» | Get the PID of the current 4D Application |
aa4D_M_Get_Expiration_Date (Deprecated) (invisible)
aa4D_M_Get_Expiration_Date (vp_Pointer_to a date or a text to get the Result)
There is no more Time-bomb for the use of the component: this shared method is deprecated.
aa4D_NP_Report_Export_Display (secured)
aa4D_NP_Report_Export_Display
Description
The aa4D_NP_Report_Export_Display command allows you to display a dialog to select what you want to display in a compare dialog or what you want to export in your remote computer.
aa4D_M_Show_Preferences (invisible)
aa4D_M_Show_Preferences ({vp_TextResult})
| Parameter | Type | Description |
| vp_TextResult | Pointer | Pointer to the text variable (or field) to get the Path. |
Description
The aa4D_M_Show_Preferences command without parameter show on Disk the content of the folder «4D_Info_Report_Prefs».
If a pointer is passed as parameter, the path of the folder is returned via $1->. If the new preferences file «4DIR_General_Prefs.json» did not exist, it is created with the default values.
aa4D_NP_Reports_Max_Set_Limit (invisible / secured)
aa4D_NP_Reports_Max_Set_Limit ({Max_Nb_of_reports})
| Parameter | Type | Description |
| Max_Nb_of_reports | Longint | Maximum number of reports to keep in the «Folder_reports». This value must be set again before each creation of a first report after starting 4D or 4D Server |
Description
The aa4D_NP_Reports_Max_Set_Limit command fix the maximum number of last reports to be kept in the folder «Folder_Reports» of the database.
If no value is passed as parameter, the interprocess variable handling this value on 4D Server will be set to 0. This value is taken care of after each creation of a report.
If the limit of number of reports is reached, the oldest reports will be deleted.
Be aware that the reduction of existing reports to the new limit is not done at once: only when creating new reports, this new limit is taken care of, and the number of reports will be reduced by 10 (maximum) after each creation of reports. You can manage the original reduction of reports yourself.
If aa4D_NP_Reports_Max_Set_Limit was not used before, the default limit is 0, and thus ignored by the component. When used, this limit must be set after every restart of the application.
aa4D_NP_Reports_Max_Get_Limit (invisible)
aa4D_NP_Reports_Max_Set_Limit
| Result | Type | Description |
| Max_Nb_of_reports | Longint | Maximum number of reports in the interprocess variable handling this limitation of reports in «Folder_reports». |
Description
The aa4D_NP_Reports_Max_Get_Limit command retrieve the maximum number of last reports to be kept in the folder « Folder_reports » of the database, or 0 if no limit was set (default).
aa4D_NP_Agent_Schedule_Call (invisible)
aa4D_NP_Agent_Schedule_Call
| Parameter | Type | Description |
| Nb_of_seconds | Longint | Number of seconds to retrieve values in memory in the stored procedure (answer in JSON, pass 0 to stop it) |
Description
The aa4D_NP_Agent_Schedule_Call command set the number of seconds for the stored procedure that calculate values without creating reports, and return a JSON answer.
aa4D_M_Agent_Get_Records_Call (invisible)
aa4D_M_Agent_Get_Records_Call
| Parameter | Type | Description |
| Vt_format_answer SQL_time_min SQL_time_max | Text Longint Longint | “JSON” or “XML” (optional, default is JSON) Minimal SQL timestamp to retrieve results (optional) Maximal SQL timestamp to retrieve results (optional) |
| Result | Type | Description |
| Content result | Text | Answer in JSON (or XML) containing the results for the SQL time limits. |
Description
The aa4D_NP_Agent_Get_Records_Call command can retrieve calculated results (using a buffer of the last 100 values) depending of the criteria.
Note: The stored procedure must be activated first (aa4D_NP_Agent_Schedule_Call)
Note for the shared methods description:
«(secured)» next to the name of the shared method of this component means that if a Host database method named «aa4D_M_Host_Allow_Report_access» exists (and is shared), it will be called to allow the execution of the shared method (see page 40 of the documentation for the code to be used in this Host method).
This method «aa4D_M_Host_Allow_Report_access» is part of the Host template database that is available with this component.
Description of the main parameter for the creation of reports
(For all shared methods that create a report, most often the second (optional) parameter).
- ContentMode Value (Type: Longint) Define the mode of the description of report (for tables)
| Main parameter value for the creation of reports: | -2 | -1 | 0 | 1 | 2 | 3 | 4 | 5 | 6 | 7 | 8 | 9 |
| Count total number of records… | X | X | X | X | X | X | X | X | X | X | X | X |
| except for invisible tables | X | X | X | X | X | X | ||||||
| Hide Table List | X | X | ||||||||||
| (Default if parameter omitted) Show all tables list, with all structure details | X | |||||||||||
| Show Table List: | X | X | X | X | X | X | X | X | X | X | ||
| Show Table number | X | X | X | X | X | X | X | X | X | X | ||
| Show Table name | X | X | X | X | X | X | X | X | X | X | ||
| Show number of records of the table | X | X | X | X | X | X | X | X | X | X | ||
| Show number of indexed fields | X | X | X | X | X | X | X | X | ||||
| Show number of subtable (if any) | X | X | X | X | ||||||||
| Show triggers | X | X | X | X |
(For all shared methods that create a report, most often the last (optional) parameter).
– Nb processes list (Type: Longint) Define the number of processes to list in the report
(Pass the value -1 to list all the (alive) processes running on 4D / 4D Server.
Discover the Component run in stand-Alone
(Opening directly the component database, and creating once a requested data file).
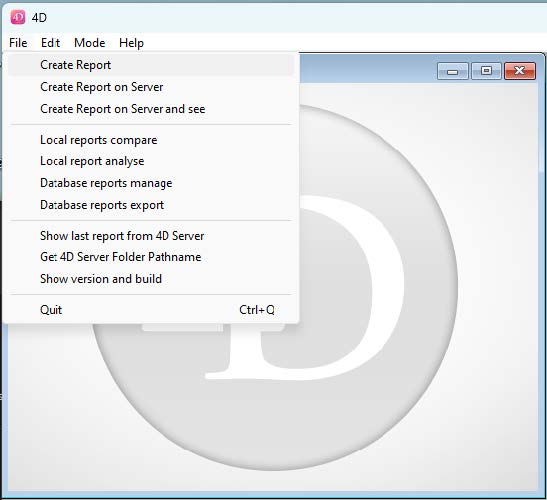
First section of the File menu:
Creation of one report
- Create Report will execute the shared method: “aa4D_NP_Util_CreateReport” (without parameter)
generating after a few seconds a new report displayed inside a dialog (see page 18) - Create Report on Server (When executed on 4D in Remote mode), will execute the shared method: “aa4D_NP_Util_CreateReport_Serv”, that will generate a new report on 4D Server
(no warning on 4D Remote when the report is created).
(When executed in local mode, will behave like Create Report) - Create Report on Server and See (When executed on 4D in Remote mode), will execute the shared method: “aa4D_M_Report_CreateOnServerSee” (without parameter)
(generating after a few seconds a new report on the Server and displayed inside a dialog)
Second section of the File menu:
- Local reports compare will execute the shared method :
“aa4D_NP_Report_Compare_Display” that display a dialog (see captures in next page) - Local reports analyse will execute the shared method :
“aa4D_NP_Report_Analyse_Display” that display another dialog to compare 2 or 3 reports. - Database reports manage will execute the shared method :
“aa4D_NP_Report_Manage_Display” that display new dialog to set the stored procedure, or import reports from 4D Server. - Database reports export will execute the shared method :
“aa4D_NP_Report_Export_Display” that display a new dialog to set criteria for reports to be compared in the reports main values, and also to import exported files (later at work).
Third section of the File menu:
- Show last report from 4D Server will execute the shared method: “aa4D_NP_Get_Last_Server_Report” that will display in an alert the last generated report on 4D Server (When executed on 4D in Remote mode), or on 4D in Stand-Alone mode.
- – Get 4D Server Folder Pathname will display in an alert the full path of the folder “Folder_reports” (located next to the (Host) data file).
- (As there is currently no way to change this location or the name of the current reports folder, no need to use a shared method to retrieve it: in you Host database code, just complete the parent Folder of the data file with “Folder_reports”.)
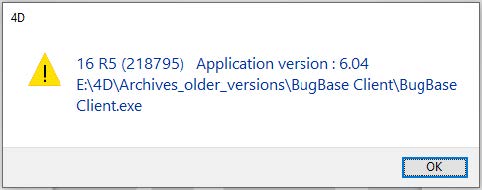
- – Show version and build will execute the shared method : “aa4D_M_Get_Build_4D_Text_call” that will let you select in a dialog a 4D application or a plugin bundle, and display in an alert:
- – the version of the file,
- the build number of the file (if it exists)
- More info (public versions) corresponding to the build number and version,
- the full path of the selected file.
Executing the shared method “aa4D_NP_Util_CreateReport” or “aa4D_M_Report_CreateOnServerSee”,
after a few seconds (the first time), a new dialog is displayed including the generated report content:
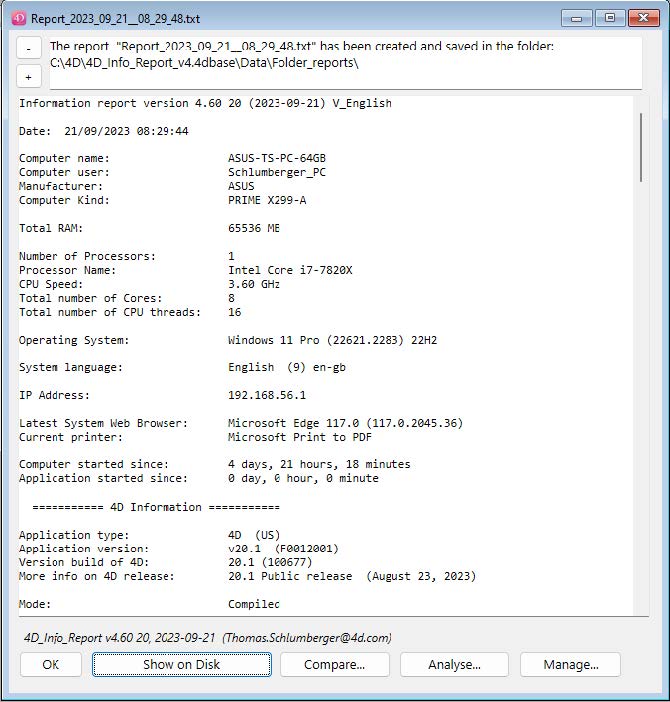
When in Local mode, the “Show on Disk” button will open the content of the “Folder_reports”, with the last report selected. The upper part of the dialog indicate where the created report was saved.
When in Remote mode, if the report was not generated locally, then you can select a local folder to save the imported reports (via the «Save in Local Reports Folder» button). If this folder is not already set on 4D remote, a dialog will let you set one.
Two buttons: “-” and “+” allows to decrease/increase the font size of the report, also when focus is on the report area. Default is 12, or the one set in 4DIR_Preferences.json (Default_Report_FontSize).
The changed size of the font will be remembered for next display of a report until restart.
Suggestion: Change manually the size value of “Default_Report_FontSize”, by default equal to 12, in 4DIR_Preferences.json, to better adapt to your screen resolution on each computer
The “Analyse” button will display a new dialog, allowing a simple comparison with one or two other reports. (use the shared method «aa4D_NP_Report_Analyse_Display»).
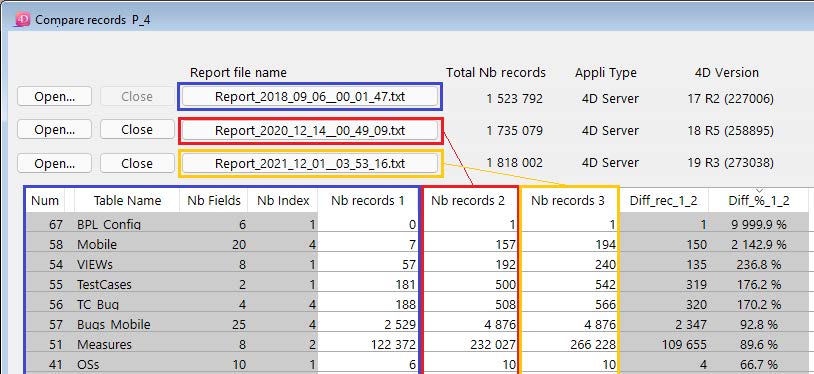
Note: if a Diff_% value displays as “9999.9 %”, this mean infinite diff. (there was no record before).
The “Manage” button will display a new dialog, allowing (in Remote mode) to import reports stored on 4D Server, and set the stored procedure that create a new report every N minute(s) (Real):
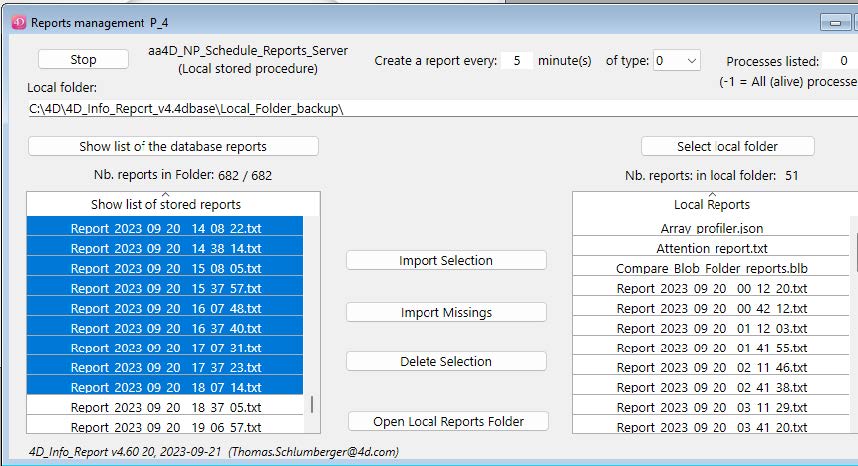
When this dialog is displayed: if the stored procedure is not already started, A «Start» button is shown: Click the «Start» button to start the stored procedure on 4D Server (or 4D Stand-Alone), with the displayed settings. If already started, the button displayed will be «Stop».
To restart the stored procedure (with new settings for example), click the «Stop» button, and await that it changes to «Start» to click it: Note that you can set a real value less than 1 minute, down to 12 seconds: enter .2 (or ,2) as the value in minute(s), for monitoring critical conditions.
The «Compare» button will display a new dialog, allowing to compare the main values of saved reports in this folder. (same as when executing the shared method «aa4D_NP_Report_Compare_Display»)
When opening the component as a database, you can display this dialog via the menu of the Application window: File/Local reports compare.
As the dialog is opened in a new process, you can handle multiple folders at the same time.
Same dialog display when executing the shared method «aa4D_NP_Report_Compare_Display»)
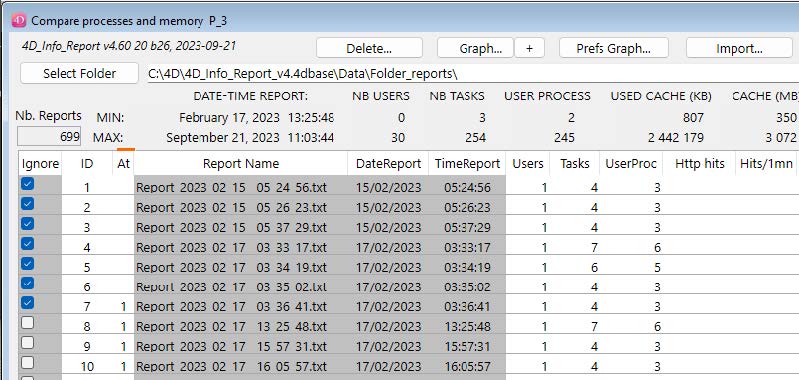
If you click one or more «Ignore» checkbox, the corresponding report will be ignored in the MINIMUM and MAXIMUM values calculation, and also when choosing the «Graph…» button.
(To modify many «Ignore» checkboxes at once, just set a selection of Row in the List Box, and click one of the corresponding «Ignore» checkbox to invert the state in the selection).
You can also double-click one row of the List Box to open directly the report.
(If you have parsed a folder, or if the Import of the Blob was done without changing the location)
Next to the «Parse Folder» button, there is a text variable where you can input or paste the path of the folder to parse.
You can also drop a folder (containing reports) over it to input the path name of this folder.
The «Parse Folder» button is used to select a folder containing reports created by the component.
If there is a valid folder path already entered next to the button, you will get this confirm dialog:
«Do you want to select another report folder?»
Clicking «Cancel» will force the parsing of the current folder, clicking «OK» will let you navigate to select another folder, and after confirmation of the selected folder, will parse this new folder.
When a folder is selected, a parsing of the reports inside this folder will populate arrays in the List box about the usage of the database.
If some reports contains «Attention :» items, the column «At» will show how many are found. If any is found in each report (in the Attention section), a red line is shown above the column.
The buttons «<«, «>« and «>>« allow to resize the width and height of the dialog.

The “Import” button allows to import a Blob generated via the Export button, that only contains the values used in the List Box.
It is much faster than processing all the reports again when there are many reports in the folder, and if the original folder is still in its original location, you will be able to open the reports via a double-click in the List box as if you have parsed the folder again.
The «Export» button allows to select a format and a name to export the content of these arrays.
You can for example:
- Generate a Blob (Compare Blob) that can be later imported to populate the List Box,
- Generate an Excel document (.xml format compatible with Excel 2003 or later),
- Generate an XML document (.xml),
- Generate a text file document (.txt).
The first column of the list box (“Ignore”) is to select or not a list of reports for further action:
update MIN & MAX,
Include in the list of values that will be displayed in the Graph, or delete these reports.
Note that you can apply a check to a selection of lines: all will get the new value after a click
The «Delete…» button is visible if at least one checkbox ‘Ignore’ has been set:
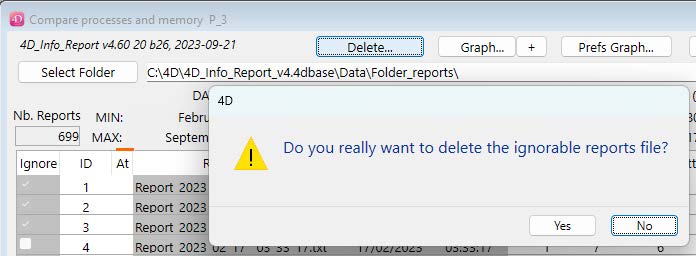
Attention: If you click «Yes», the reports with ‘Ignore’ checkbox checked will be deleted from the parsed folder.
Note: this feature also works on 4D remote, as long as the location of the folder of reports is local (not on 4D Server).
There are two lines (MIN and MAX) above the List box: These 2 lines shows the Minimum and Maximum values found in not ignored reports for each type of information.
Explanations of the Pref Graph and SVG form

The «Prefs Graph…» allows to set the default display settings of a graph: these settings can be stored on the computer, and will apply each time the component is used to display a graphic:
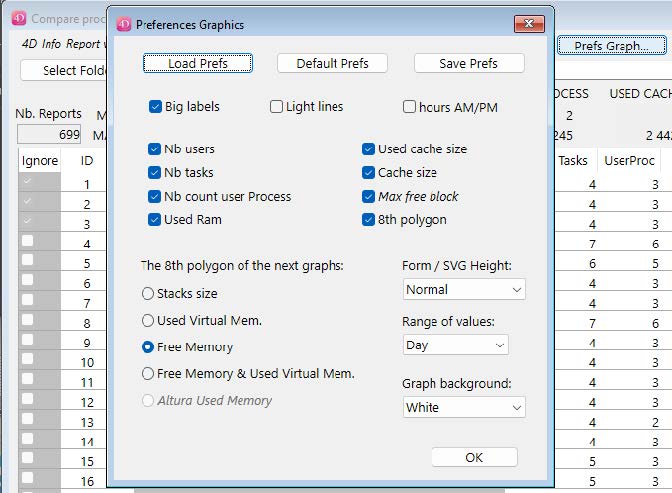
If the “8th polygon” is checked, choose what radio button correspond to your choice: it can be the Stack size (sum of the Stack size, default value) or another choice to display in the graph (as the eighth polygon) for example the variation of the Used Virtual Mem (Memory), or Free Memory (in RAM), or both.
Note: when the Graph window is displayed, via the button «Update SVG», if you use Shift down or Right click, the 8th polygon will alternate among four of these kinds of values.
When parsing older reports (*) Reports that are created with v17 32-bit application under Windows
- Used cache Size : 3 247 KB
- Free Memory : 5 343 852 KB
- Used physical memory : 127 928 KB
- Used virtual memory : 557 980 KB
- Size of stacks : 3 692 KB
- Altura Used Memory : 1 166 KB (*)
- Biggest free block in cache : 25 599 KB (*)
The “Graph…” button will display a new dialog with an SVG graph displaying the values of the arrays.
(if less than two reports (not ignored) is listed in the List box, the “Graph…” button is invisible)
If you click this button with Shift down or Right click, you force the display of a new Graph dialog. Same with “+”. If Alt (Option on macOS) is down, this graph dialog will be condensed vertically.
Otherwise, if a related Graph dialog already exists for the compare dialog, it will be brought to front:
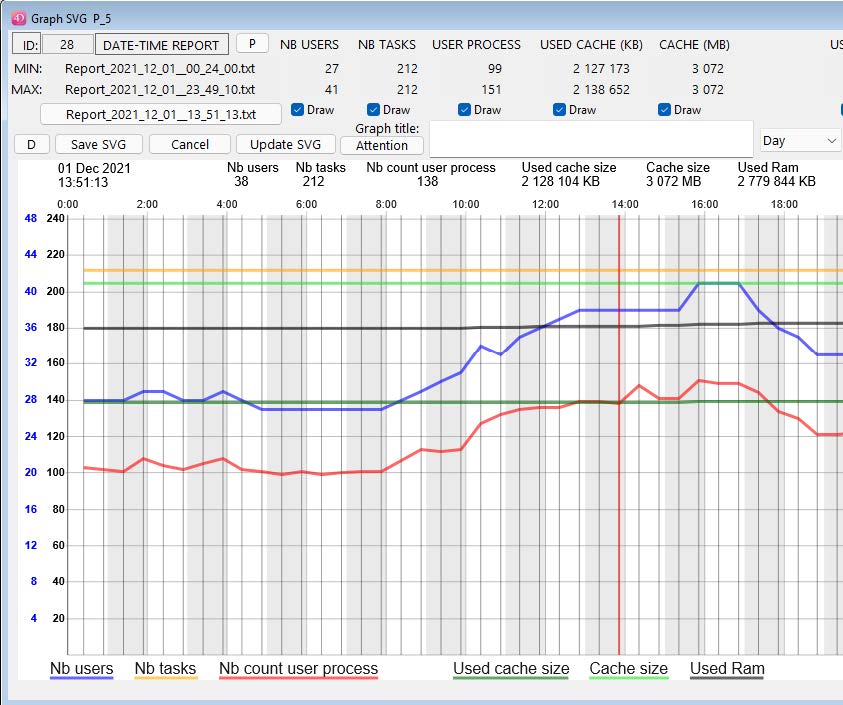
Click the «Draw» checkboxes to display or hide the polygon of the corresponding kind of values.
If you click the button «Update SVG», you will force the redraw of the SVG area. If a Graph title is entered (two lines allowed), it will be added in the top of the Graph.
If Shift down is pressed (or Right click) while clicking, you will rotate possible values for the 8th polygon:
Default: Stacks, or Used Virtual Memory, or Free Memory (see the Prefs Graph… settings).
If you click on the small button “D” at the left of «Save SVG», you will switch between different mode of display for the «Left» polygons, that is «Nb users», «Nb tasks», «Nb count user process».
When one of the corresponding checkboxes is checked, you can toogle the display for these three polygons:
When the button show the letter «D» (default), if both Nb users and one of the two other checkboxes is checked, you will see a double mark (scale for users in blue, others in black), or a single mark (for all).
When clicking this small button (or when using the shortcut «Command/Crtl G»), it will switch to a single mark («S» : same scale for all) if not already the case, then will switch to «L» (Logarithmic scale), and then to «H» (hide (Left values) polygons). Clicking again will return to the default display («D»).
Here are the 3 or 4 kind of display for the «Left» values:
If you see a separate blue Y serie of values on the left, it corresponds to the value of the «Nb users»
There are 4 hidden buttons in the Graph dialog:

If you click in the rectangle surrounding “ID”, you will switch the size of labels and marks:
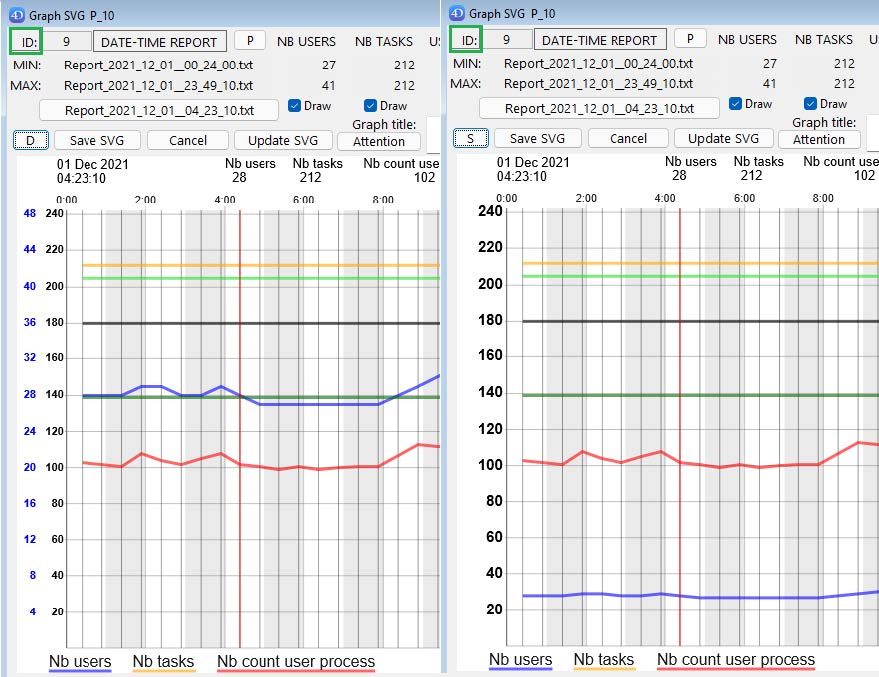
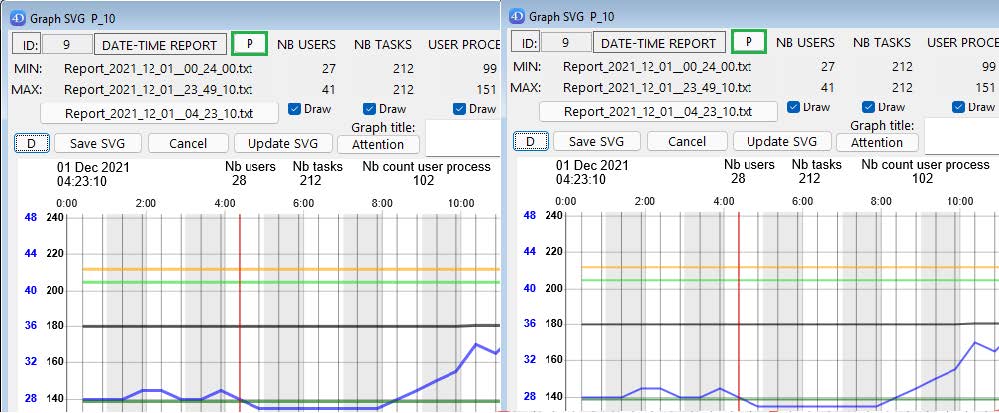
If you click the button “P”, you will switch the polygons thickness (regular / thin)
– If you click in the rectangle surrounding “DATE-TIME REPORT:”, you will switch the vertical size of the Graph dialog, from Normal (with MIN and MAX values visible), to Small (condensed):
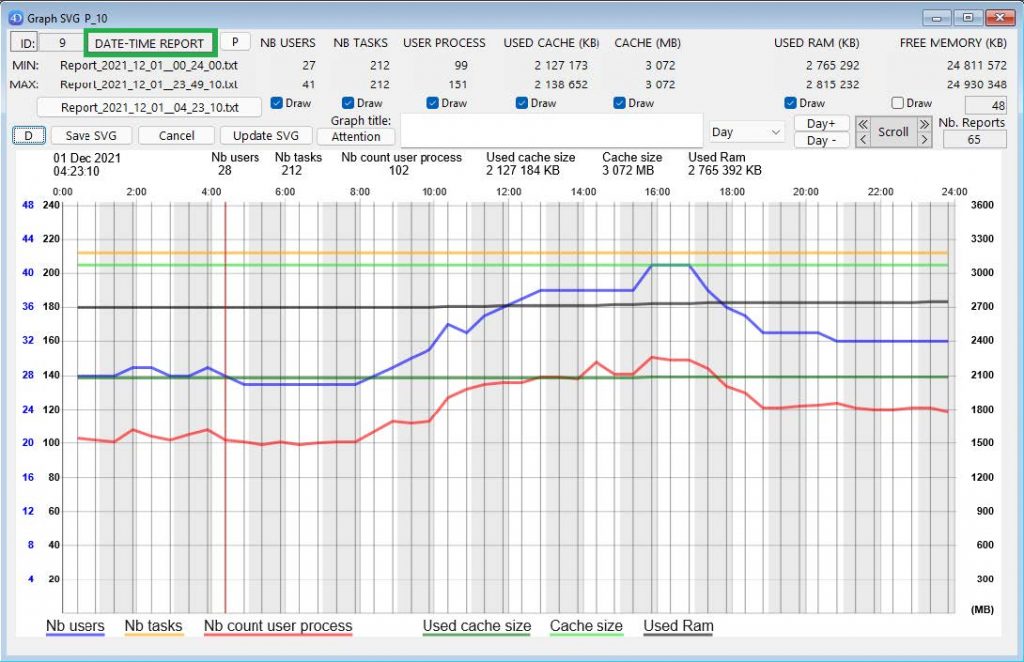
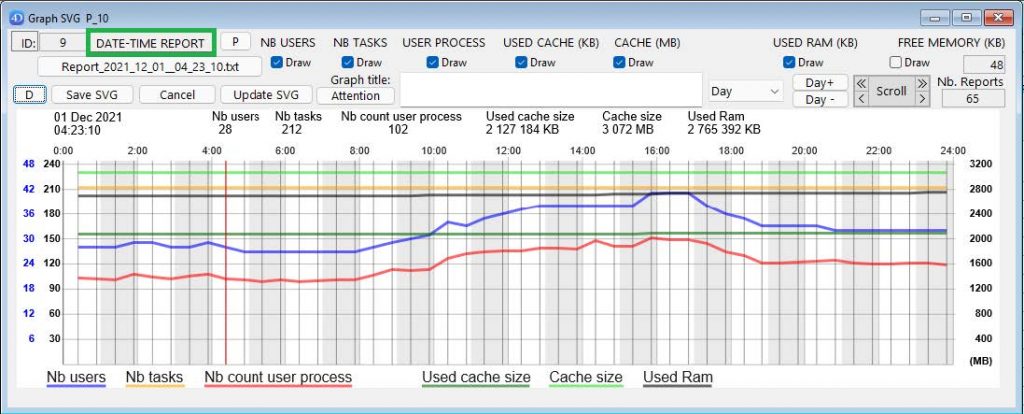
Note: this size switch via this button is convenient to force a proportional resizing of this window.
If you click the invisible button between “ID:” and “DATE-TIME REPORT” (new in v4.20)
(in this example, where is displayed “9”, the index of the current report selected in the graph), you will switch the SVG Background color, as via the Preferences Graphic” dialog:

(default color in the “Preferences Graphic” for the background is “White”).
To zoom in a selection of the Graph:
(Zoom is only available in the default view “Report” of the graph, not with “Day” view).
Click twice to set the left limit, and right click (or Shift click) to set the right limit: the new selection will be highlighted briefly after the right click,
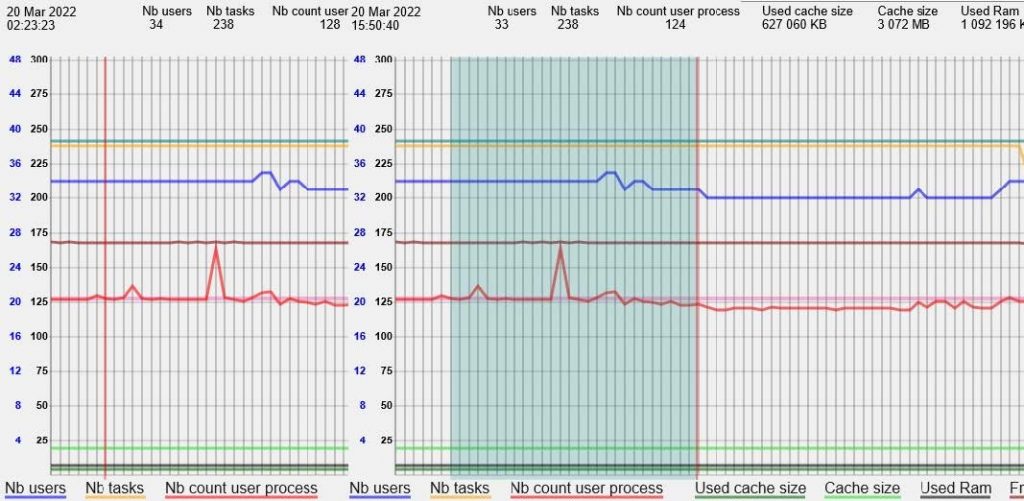
before the application of the display of the selected reports:
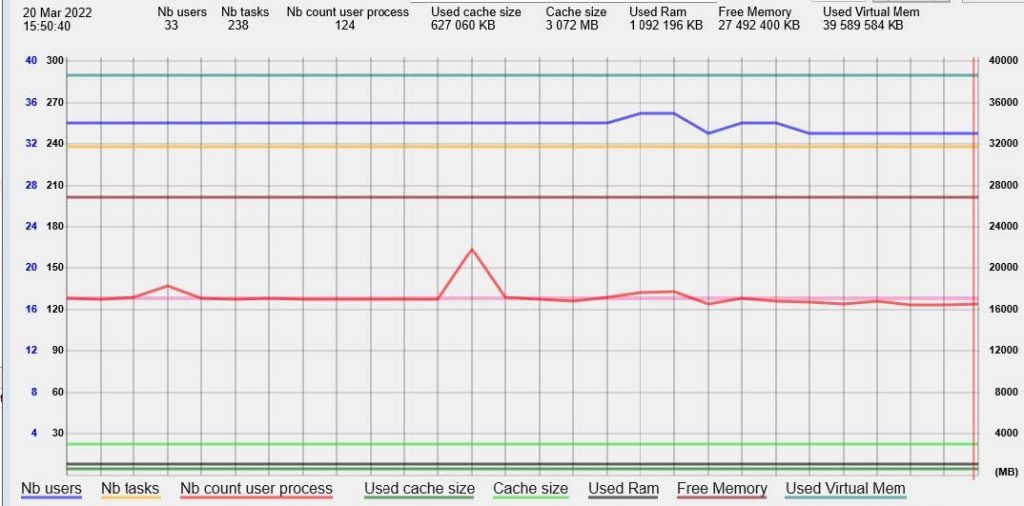
The Min and Max are recalculated, and the zoom applied. To un-zoom, hit the Delete key.
(you can cumulate zoom actions).
There are two kinds of values displayed as polygons:
the first ones (scaled on the left) are related to: the number of users, tasks, and user processes.

Depending of your choices and the max values, there will be one scale (for users only, in blue) and a common scale in black for the other two left values, or a common scale for these 3 values (see page 23 for more details on the left scales).
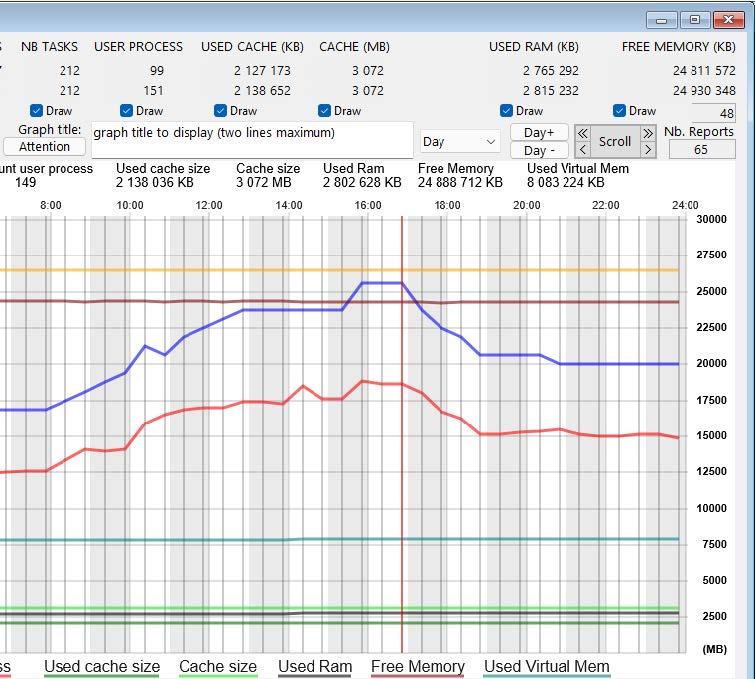
– the second ones (on the right) correspond to the memory usage, and are related to: the used cache size, the cache size, Used ram, Used Virtual mem, total stack size. (scaled in the right of the graph). The kind of values displayed depend by default to the settings in the Preferences Graphics panel, and also what checkboxes are selected (“Draw” checkboxes below their respective labels):
To save in SVG the main display of the Graph:
Click the «Save SVG» button, you will save the graph in an SVG document, after setting the name of the document and selecting where the document will be stored.
To display the content of a report:
If you click in the graph, the nearest report will be highlighted, and the values of this report will be displayed in the top of the graph: then just move the mouse X on the left or the right to get these values updated.
If the vertical line is red, there is at least one attention in the report, otherwise the line is blue.
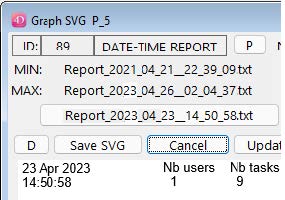
When a report is selected via a mouse over, the name is displayed as the title of a button, and the index of the report in the selection is displayed next to the ID.
To open directly the corresponding report to display it’s content in a reduced window:
Click the button containing it’s name or Double-click in the graph the highlighted corresponding report:
(same result as a double-click in one of the line of the List box in the Compare dialog)
A reduced windows with the report content will be displayed.
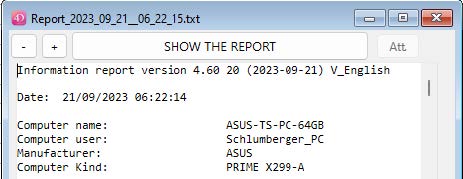
If you click “SHOW THE REPORT”, the report file will be selected in your disk.
(if “SAVE THE REPORT” is displayed, you can load and save locally the file from the Server).
To display the main values of the report with Mouse over the graph
While the horizontal position of your mouse is over the graphic with the polygon (between the scales), the corresponding main values of the report are displayed on top of the graph, including the short date and time.
If the mouse is over the name of a polygon below the graph, see page 33 for some explanation.
Precise selection of a report in the graph: To be sure to move to each report next to the blue (or red) vertical line, you can use the Keyboard Left Arrow Key or the Right Arrow key.
Note: to escape this Mouse over mode, move the X position left or right of the graph part displaying the polygons, or above the graph.

Scrolling the graph (in the “Report” mode only, not in “Day” mode)
Mouse over one of the four arrow sections in the top of the dialog.

Zooming in the graph without selection (in the “Report” mode only, not in “Day” mode).
(in “Day” mode, “Zx” labels are replaced by “Day” labels)
With these two buttons, you can increase or decrease the scale of the X values.
- with Zx +, you will scale the X values up to ratio 256
- with Zx -, you will scale down the X values to a quarter of the default scale:
(clicking again this button will switch the scale to half, quarter and scale 1).
You can also scale up or down via the keyboard Up Arrow Key and Down Arrow Key.
Display of the current Attention section
If the button «Attention» is enabled (at least one report has an Attention item), you can click once to get a pale pink polygon,

The vertical step show the number of Attention item found in the Attention section of each report.
If you click another time, this new polygon will appear darker, and other polygons will be dimmed.
(If you click again another time, this Attention polygon will be hidden.).
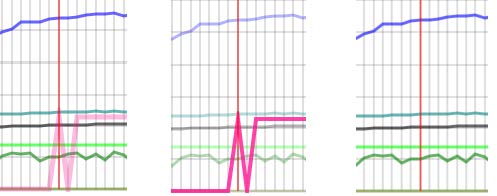
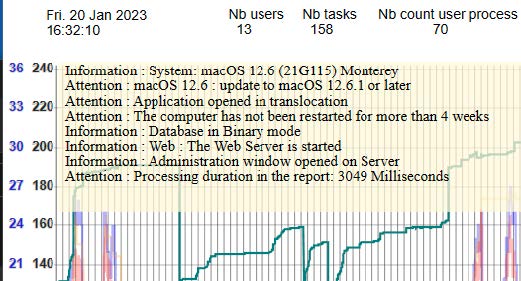
The content of the Attention section is also displayed in the Graph:
When moving the mouse over reports in this mode, if there is at least one Attention, you will get the detail of the Attention section displayed on top of the SVG graph (at the opposite side)
This text is drawn over a background rectangle (with some transparency)
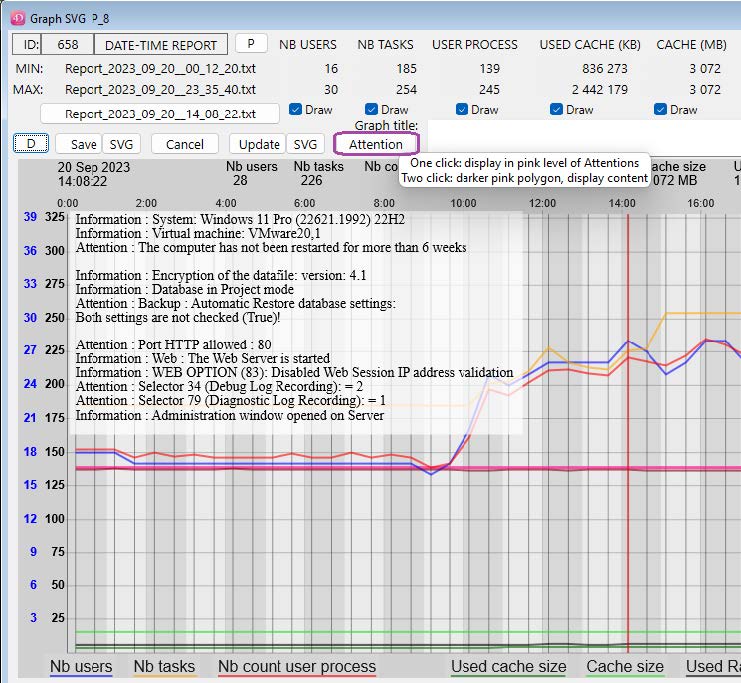
If the background color is a pale yellow, it means that the content of the Attention section changed compared to the Attention section of the previous existing report, otherwise it is white.
The dynamic display of the Attention section avoids the need to open the related report to check its content. Once this content is displayed, you can click again the Attention button to change the display of the other polygons.
Vue by ‘Day’ instead of the default vue by ‘Report’ (also set via the Prefs Graph…)
If in the pop-up (at the left of the zoom Zx buttons) if you choose ‘Day’, a day view will be displayed.
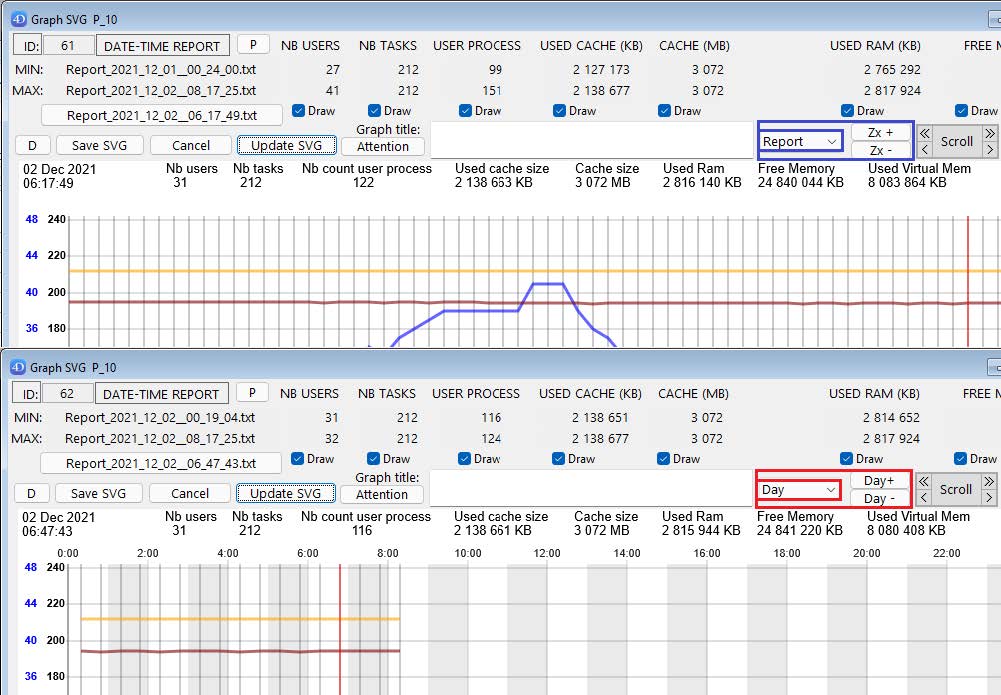
This ‘Day’ view will be scaled for X values on the 24 hours of the current selected day.
Alternate vertical background will mark each hour of the day.
If a current report was selected in the ‘Report’ view before switching to the ‘Day’ view, then the daily reports will correspond to the current day of this selected report.
(if no report was selected, the day of the last report will be displayed).

When “Day” is selected, you can now navigate to previous or next day (if it exists):
(the “Z+” and “Z-” buttons labels are replaced with “Day+” and “Day-”)
(if when clicking, you shift down, you will move to the next or previous week same calendar day).
You can switch back to the ‘Report’ view (where you will be able to scroll).
The highlighted report should remain the same when switching the view.
Highlight of a specific polygon in the SVG Graph:
A Graph with many polygons displayed and many values reported might be difficult to read.
If you want to pay attention to a particular set of values (users, cache, memory), it is now easy to highlight the specific polygon without de-activating the display of other polygons (via uncheck of their Draw checkbox).
With your mouse, just mouse over the label of your choice, in this example “Nb Users”:
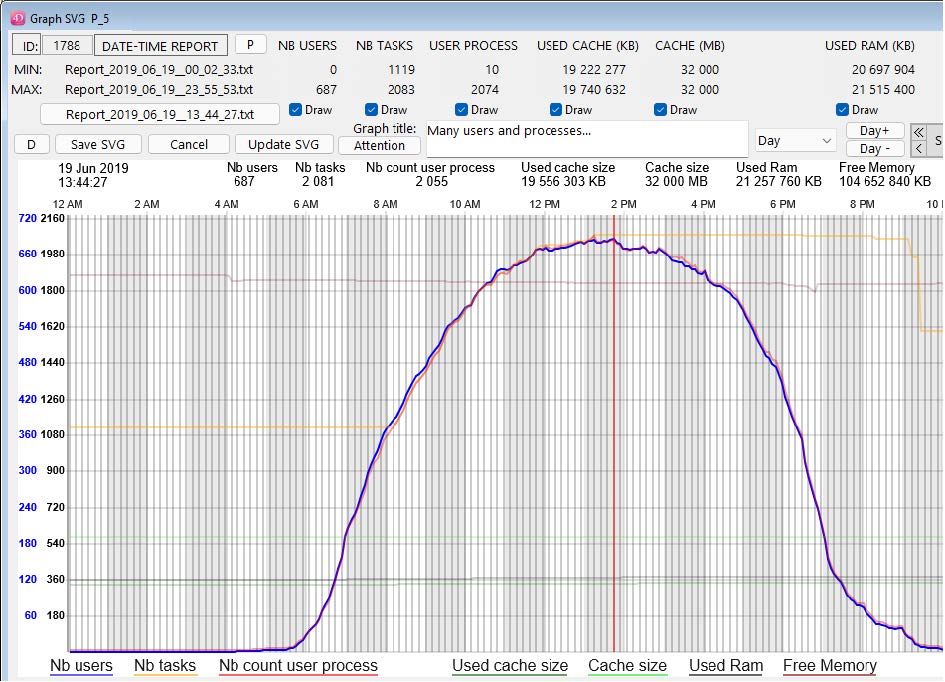
The selected polygon of the corresponding label with get the most Opacity to be the most visible, and the related other values (in this case “Nb tasks” and “Nb count user process”) will also get la lighter opacity.
All other displayed polygons will be more transparent to ease the readability.
To leave this mode (back to normal display), just move the mouse lower than a label once.
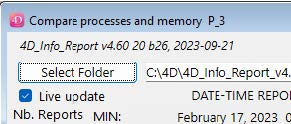
If the requested reports include the daily reports from the Server, a new checkbox ‘Live update’ will appear on the Compare dialog (in Remote mode):
If the stored procedure creating reports is started on the Server, if you click the checkbox, the new created reports values will be added to the current list of values.
If you open a Graph dialog from this Compare dialog, it will also complete the polygons with the created reports. (you can also auto-complete the graph when in the ‘Day’ view) with each new created report, that will complete the List box and/or the SVG Graph.
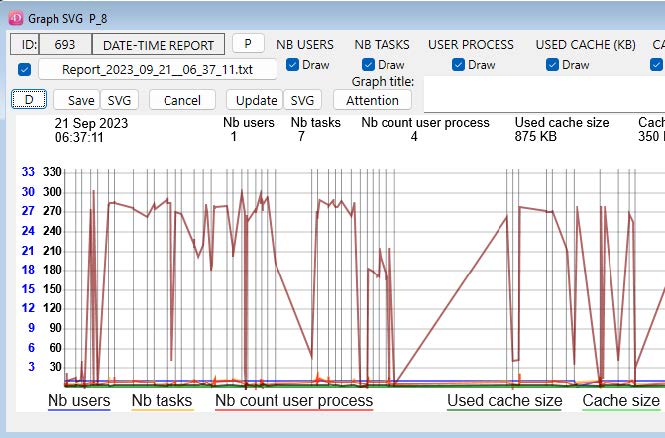
Reminder about the updated buttons in the Compare dialogs in v4.60 (also reminded in help tips):

(the “+” button is to display a Graph dialog in a new process)
Remote access to the reports (and values shown in the List box of the Compare dialog)
A dialog is available (also in Remote mode), via the method «aa4D_NP_Report_Export_Display» * (or the menu “File / Database reports export” when the component is opened directly)
If there is one menu item (for access to “4D_Info_Report” for administrators) that you implement in your Host database, we recommend that it executes a simple method like this:
ARRAY TEXT($at_Components;0)
COMPONENT LIST($at_Components)
If (Find in array($at_Components; “4D_Info_Report@”)>0)
// If the component is recognized
// to display this dialog of the component:
EXECUTE METHOD(«aa4D_NP_Report_Export_Display»)
End if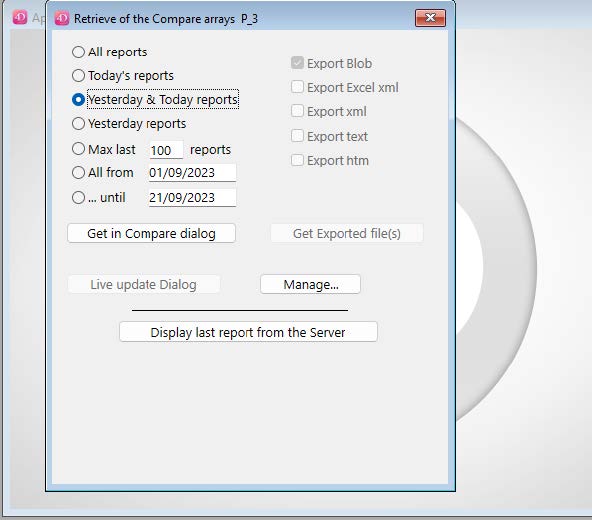
After selecting (or entering) your criteria in the Top/Left part of this dialog, if you click the button
“Get in Compare dialog”, a new dialog will display the values retrieved from the 4D Server, similar to the one displayed via «aa4D_NP_Report_Compare_Display». From this new dialog, you will be able to sort the values displayed in the List box, or display a SVG Graph.
If you click the “Manage…” button, you will access the Manage dialog, to start or stop the stored procedure, or import reports from 4D Server.
Below “Get in Compare dialog”, there is this button: “Live update dialog”.
If you click this button, you will directly get the Compare dialog with the next reports from the stored procedure. If this stored procedure is not activated, it will be by clicking this button, creating regular reports every 12 seconds.
In the compare dialog, the “Live update” checkbox will be checked directly.
(Remind to stop the stored procedure when you no more need it via the “Manage” button).
If you click the button “Display last report from the Server”, the last report created (on the Server if the dialog is displayed in remote mode) will be searched and displayed.
It will be the last created local report displayed when in Stand-alone mode.
If no report was created by the component already, nothing will happen.
The creation of reports can handle some errors:
If (for example) you have started the stored procedure to create reports every N minute on the Server, and the current folder where the new reports are saved is no more available:
- The component will automatically create a new folder in the “4D_Info_Report_Prefs” folder of your computer (this is where are stored some preferences and scripts of the component).
(It will also recreate the Array_profiler.json, like during the creation of the first report after the restart of 4D or 4D Server):
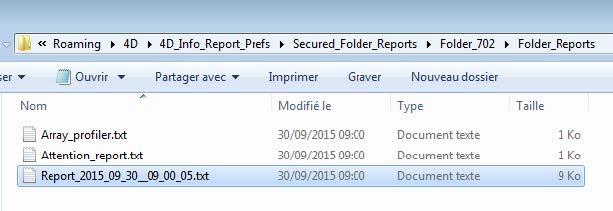
So with this version, if for any reason the «Folder_reports» (by default next to the Data file) is no more available, Check if there is a folder named «Secured_Folder_reports» in the Temp folder.
If this folder exists, check what is the latest created folder inside:
(These created sub folders are named «Folder_’ followed by a random number between 100 and 900)
Inside this sub folder, there is a unique «Folder_reports» that contains the last created reports.
If the folder containing your created reports is no more available:
Attention : Your folder ‘Folder_reports’ was no more available !
({your current location}\Folder_reports\)
A ‘Folder_reports’ was created and is now used in the 4D_Info_Report_Prefs folder :
(C:\Users\{currentuser}\AppData\Roaming\4D\4D_Info_Report_Prefs\Secured_Folder_reports\Folder_702\Folder_reports\)
If you have set another volume for the folder to contain the report
(via the shared method: aa4D_M_Folder_Rep_SetPath_local)
and this volume is by accident disconnected, the reports will still be created (in this new folder).
Also tested, the access of the Data file: if there is an error accessing the volume or the Data file itself, a new Attention will be created in the current report. The component will try again to access it when creating the next report.
The Attention_report.txt is created or updated when:
There is a new content of the Attention section in the last created report, with at least one Attention raised, not just Information line(s).
Example of a content of the Attention_report.txt:
Creation: 2023_09_20__17_37_23 V_English
Information : Operating System: Windows 11 Pro (22621.1992) 22H2
Information : Virtual machine: VMware20,1
Attention : The computer has not been restarted for more than 6 weeks
Information : Encryption of the datafile: version: 4.1
Information : Database in Project mode
Attention : Backup : Automatic Restore database settings:
Both settings are not checked (True)!
Attention : Security risk : Port HTTP allowed : 80
Information : Web : The Web Server is started
Information : WEB OPTION (83): Disabled Web Session IP address validation
Information : Selector 44 (SQL Engine Case Sensitivity): = 1
Attention : Selector 34 (Debug Log Recording): = 3
Attention : Selector 79 (Diagnostic Log Recording): = 1
Information : Administration window opened on Server
(Raised information there cannot compensate an in-depth analysis)4D:4D_Info_Report_Prefs
Note: Location of the folder “4D_Info_Report_Prefs” (in Get 4D folder(Active 4D Folder) :
On Windows: C:\{Users}\{User name}\AppData\Roaming\4D\4D_Info_Report_Prefs
On macOS: {System volume}:{Users}:{User name}:Library:Application Support:
4D:4D_Info_Report_Prefs
The Format and content of the generated reports
1/ All generated files have a structured name:
For example, if a report is created in September 21, 2023: “Report_2023_09_21__15_36_49.txt”
All reports name begins with “Report_”, followed by a Time stamp formatted this way:
“YYYY_MM_DD__HH_MM_SS” (Y=year, M=Month, D=day, H=hour, M=minute, S=second)
If a report is created during End of Daylight Saving Time, and detected as older than a previous daily report, it will have a “-2” added to it’s name: Report_2022_10_25__02_19_55-2.txt
To later process a report via the component, don’t change the name of the document.
2/ Each document is generated with a UTF-8 format, with all lines ending with CR+LF, or LF
They are Cross platform (macOS and Windows).
There was 3 byte BOM at the beginning of the document: No more the case in v4.50 (default settings)
3/ The content of the report is structured, allowing the component to find searched items.
Also, Reports created with French releases of 4D can have French labels, with parsing compatibility.
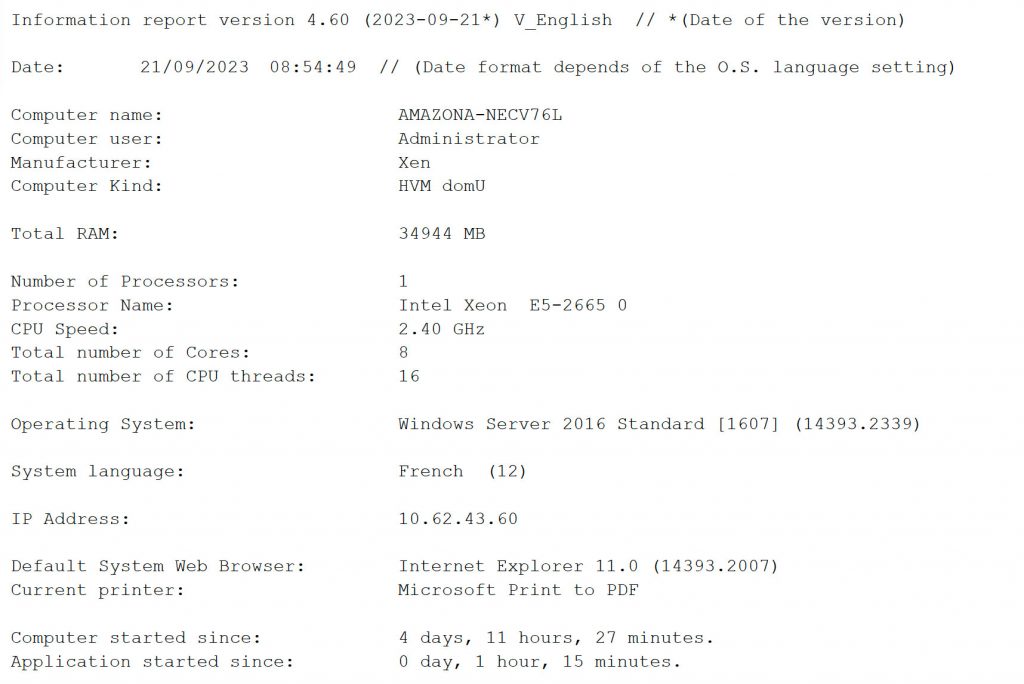
A/ The Header: (general description of the Computer):
B/ Description of the 4D Application : (version and build of 4D, version of the built application)

(“More info on 4D release” line is added if the build number is identified as a Hotfix or a Public release).

C/ Description of the Database (size, location, plugins, components, settings):

(New information retrieved since v4.9rZG, when running v17 R3 or later):

*********** Attention section ***********

Note: It is important to read this Attention section, as it contains a summary of possible causes of problems, and also some reminders (Information).
Typical elements in the Attention section:
= Attention when a log is activated
= Attention or Information about the Operating system
= Some low limits are reached (available space in a volume, memory, cache usage)
= Some settings are not the recommended ones.
= Some Hardware (real or emulated) numbers are low (RAM, CPU speed, number of CPU-threads).
= The current IP of the 4D Application has changed.
= Information if a Virtual machine is detected
= Information if the Legacy network layer is detected*
= Attention or Information if the Host Database is not in Unicode mode*
When this section Attention is populated in a report, a new «Attention_Report.txt» file is generated if previous Attention content has changed, with the content of this section, so it is quite easy to detect and read, when checking the content of the Folder_reports.
When this Attention section is updated, the new content is sent to the Host database if the Host method «aa4D_M_Host_Attention_Reported» exists in the Host database and shared with components.
// Method: aa4D_M_Host_Attention_Reported
//
// IMPORTANT: This method must keep it's original name and be shared with components,
// to be used by 4D_Info_Report.
//
// If a new Attention_report.txt is created in Folder_reports,
// This Host method will receive the content of this file via a Blob.

C_BLOB($1)
C_BOOLEAN($0) // Currently, value of $0 does not matter

C_TEXT($text)
If (Count parameters>=1)
$text:=Convert to text($1;»UTF-8») // (to be compatible with non Unicode mode database)

// -- you can customize this part to handle or not the Attention received --
If (Application type#4D Server) // Don't show an Alert on the Server

// ALERT($text) // To verify that you have received something
End if

// ---- Add your own code to process the Attention content here ----
End if
*To detect Timeout about the Host database, add and share this method (LegacyNetworkLayer):
// Method name: aa4D_Host_GetDBParam (must be shared with components)
C_LONGINT($1) // selector
C_REAL($0)
$0:=-1 // Error, no parameter
If (Count parameters>0)
$0:= Get database parameter($1)
End if
If you are developing your (Host) database, and this shared method is not already implemented, when creating a first report, the component will now ask you if you accept to create it (if not serverNet).
This will be asked every time you open your interpreted database, but you can change this behaviour by modifying the content of the new preference file: 4DIR_General_Prefs.json
This file contains these key/values:
| version | 2 |
| date_year | 2023 |
| date_month | 10 |
| date_day | 1 |
| askHostMethodCreation | true |
Just edit the file and change the value to false for the key askHostMethodCreation to avoid getting this request daily (if the Host database is run interpreted and the component is loaded).
To access the folder “4D_Info_Report_Prefs”, use the new method “aa4D_M_Show_Preferences”.
D/ Infos on the Tables (num, name, nb records, fields, indexed fields, subtables, triggers):
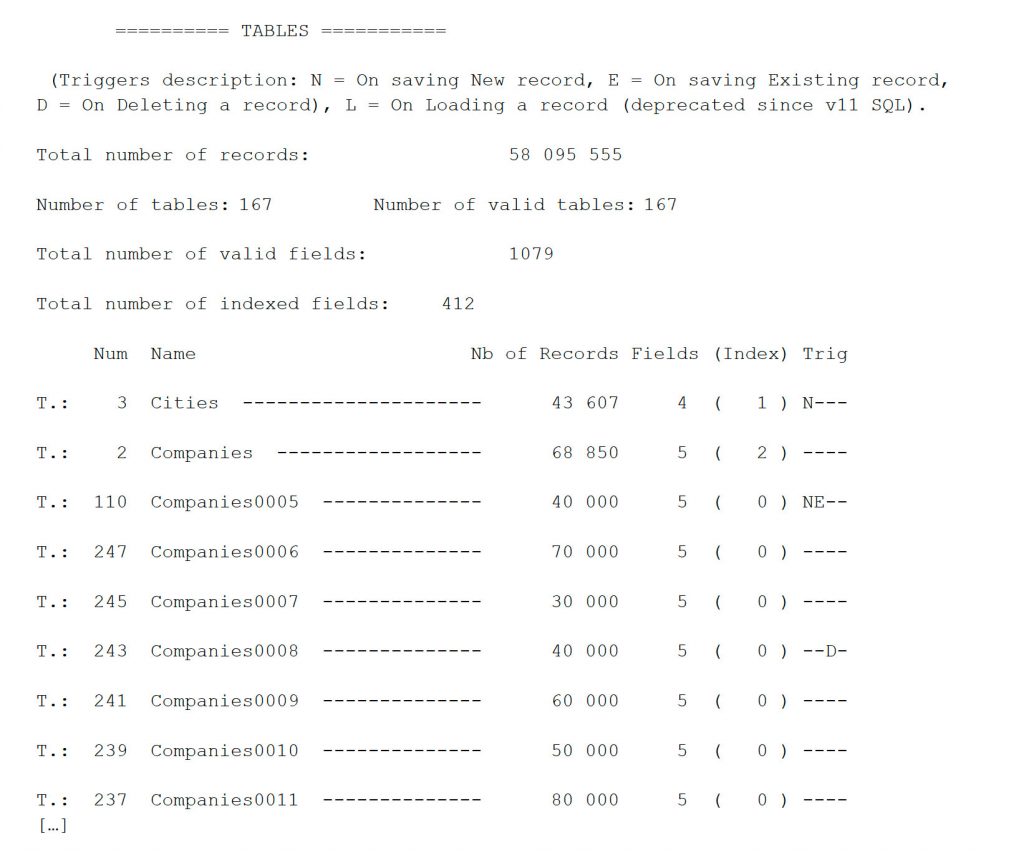
The table description is optional, you can avoid listing them, hide structure information (only showing the number of records), hide “Invisible” tables, etc…
See ‘ContentMode Value’ in this article for the optional setting of the format of this list.
The total number of records will always be reported. (with option on Invisible tables).
Last implementations/changes
Version 4.60
More info from a file (or package) (New in 4.60):
- Under macOS, you can get the version (and CFBundleVersion) of Xcode.app: (since v4.53) “14.1 CFBundleVersion: 21534.1” (via aa4D_M_Get_Build_4D_Text_call) (Get info also when selecting an external component “4D_Info_Report_v4.4dbase)
- If the component contains in its Resources folder a file name ending by “Manifest.json”, with a key “version”, the value will be added as the detail of the component.
(“Version (Manifest): “+value)
- You can retrieve the info of a 4D application located on a mounted shared volume under Windows.
- With a valid content structure as expected (provided by 4D), the “More info on 4D release:” line will be added in the reports, with the matching description from the file, followed by a “*”
- More older versions of 4D (older than v11) are identified after selection of the .exe file
- Selecting the Info.plist of a regular macOS 4D application under Windows properly retrieve the version and build of the application.
If there is an optional updater file in the Resources folder of the component, like “Vers4D_updater_v461.json” With a valid content structure as expected (provided by 4D), and a valid naming (…_vXYZ number must be larger than the current version vX.YZ), the identified version will be applied to the unidentified build number, followed by a “*”. For example:
{
“Versions_identification”: {
 “v20_0”: [
 {
“build”: 285662,
“description”: “20.0 New icon (March 21, 2023)”
},
This line will be added in the report: “More info on 4D release: 20.0 New icon (March 21, 2023)*”
Version 4.60
New shared methods:
Starting with v4.60, every minute (at the maximum), the stored procedure that is executing will test if a new delay value has been set and apply this new delay value without requiring a stop and start, and if the stored procedure must stop working as soon as possible.
aa4D_M_StoredProc_frequency_Set (preemptive, invisible, executed on the Server)
aa4D_M_StoredProc_frequency_Set ({Frequency}) optional
| Parameter | Type | Description |
| DelayBetween | Real | If >0, new minute(s) frequency to be applied to the stored procedure. |
Description
The aa4D_M_StoredProc_frequency_Set shared method set the frequency of the stored procedure with the passed argument.
If no parameter is passed, then the value 5 (in minutes) is applied.
The only difference is that it will create the report on 4D Server when executed in Remote application.
aa4D_M_StoredProc_frequency_Get (preemptive, invisible, executed on the Server)
aa4D_M_StoredProc_frequency_Get
| Result | Type | Description |
| DelayBetween | Real | Defined in minute(s) the delay between two reports |
Description
The aa4D_M_StoredProc_frequency_get returns the current value of the delay (real or numeric) between the creation of reports in the Stored procedure, set previously.
IMPORTANT: To get a valid result, You must have set once DelayBetween since startup via the setter method “aa4D_M_StoredProc_frequency_Set”.
If you didn’t set a value before, you will get -1 as the result.
NOTE: can replace the older v4.20 shared method “aa4D_M_Schedule_Reports_Info” that was not preemptive, but didn’t need to set a value before.
aa4D_M_CreationReports_Allow (invisible, executed on the Server)
aa4D_M_CreationReports_Allow
Description
The aa4D_M_CreationReports_Allow shared method set a general flag to proceed normally the creation of reports, and the handling of the oldest reports if a limit has been set.
This shared method must be executed if the reverse shared method aa4D_M_CreationReports_Stop has been executed before.
Version 4.60
New shared methods (following):
aa4D_M_CreationReports_Stop (invisible, executed on the Server)
aa4D_M_CreationReports_Stop
Description
The aa4D_M_CreationReports_Stop shared method set a general flag to stop as soon as possible the creation of a report. This general flag is tested in various place in the code before generating the report file, and also before handling the oldest reports when aa4D_M_Reports_Max_Set_Limit has been executed.
Completed macOS model identifiers: (reports, Array_profiler) (since v4.53)
if model is only identified as “MacX,Y”, the family model will be added after ” _” for all mac models handled, the year of the model, the processor, and screen size* complete the description (*If applicable).
for example:
- “MacPro 7,1” will be identified as “Mac Pro 7,1 _ (2019, Xeon)
- “Macmini 9,1” will be identified as “Mac mini 9,1 _ (2020, M1)
- “Mac 14,15” will be identified as “Mac 14,15 _MacBook Air (2023, M2, 15’)
- “Mac 14,14” will be identified as “Mac 14.14 _Mac Studio (2023, M2 Max)”
- “Mac 14,12” will be identified as “Mac 14.12 _Mac mini (2023, M2 Pro)”
- “Mac 14,6” will be identified as “Mac 14.6 _MacBook Pro (2023, M2 Max, 16’)”
The Year of the model and the model info can be useful to identify for example what (older) mac models are not compatible with Sonoma, like this one: iMac18,3 _ (2017, i7, 27′)
(not all Apple mac computers are identified, but many Mac Pro, Desktop and Laptop are).
Server compatibility for the display of the dialogs of the component.
For some local Server configuration, with rather low activity, if a console is displayed on the Server (not faceless), you can from this console dialog execute the shared methods of the component displaying dialogs for a direct access, without using a remote application.
This might be convenient to get more than the Administration Windows (or the Runtime explorer), as an alternative way to monitor a Server activity next to the Server computer.
Displaying Windows on the Server is not recommended by 4D, but it is up to You starting with v4.60.
Version 4.50
INTERFACE (New in 4.50):
1/ Zoom buttons (and changed font under Windows: Consolas for proportional font)
- In the dialog displayed after creating a report, there are now two buttons (“-” and “+”) to decrease/increase the font size of the report area (see page 17)
- These buttons are also visible when you open an existing report (double-click inside the List box of the compare dialog or the Graph area)

2/ Attention button (“Att.”)
If there is at least one Attention detected in the report, a button “Att.” is also enabled (top right)
If you click on this button, a new window will display the content of the Attention section:
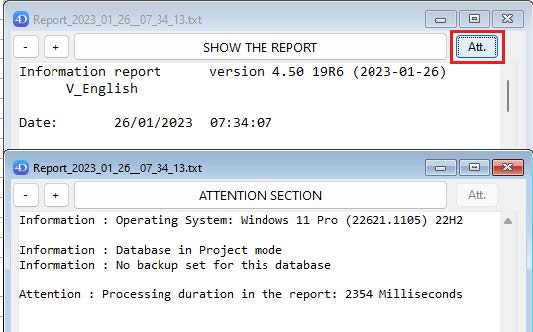
(notice that in this example, the zoom factor has been changed in the frontmost dialog).
3/ Doubled buttons (to allow a click without Right click):

In the “Compare” dialogs (when there is more than one report listed):
There is a new button at the right of the “Graph…” button: “ + ”
When clicking on it, there is a New process displaying a Graph dialog, even if there is already one linked to the Compare dialog process.
In the “Graph” dialogs:
There are two new buttons “SVG” after existing buttons:

The first one (“SVG” next to the “Save” button) will include in the saved .svg file the interacted display of the Graph:
The second one (“SVG” next to the “Update” button) will alternate the display of the right polygons.
These two buttons behave as if you use the Shift Key while clicking, as before.
They are more convenient when using a Touch screen, or when just using a mouse.
You can alternate the white or grey background of the graph:

Click the (empty or filled) rectangle next to the ID rectangle to alternate the background
Version 4.50
4DIR_Preferences.json file (New in 4.50):
This new file is in the “Resources” folder of the component, and can be removed (not suggested) and is also used by 4D Server when creating new reports.
It has these default values:
{
Use_LF_for_end_of_line: true
Dont_add_a_BOM: true
Default_FolderReportsName: «Folder_reports»
Default_Report_FontSize: 12
}
Use_LF_for_end_of_line and Dont_add_a_BOM: true is set by default
You can change them if you need it (false instead of true to get back to the original reports text, that include a BOM and end lines with CR/LF), but keeping the default true value will save one Byte per line (and 3 Byte in header of the files):
This reduction of the size of the Reports is significant with many lines.
If the file “4DIR_Preferences.json” is removed (or the Key removed/renamed), the new reports will keep their historical format: BOM (UTF-8) and CR/LF at the end of each line.
Default_FolderReportsName: «Folder_reports»
You can set your own default folder name, that will be used if the default name “Folder_reports” is not found next to the Data file (or if the default path name of the folder if not set via the shared method:
aa4D_M_Folder_Rep_SetPath_local)
Default_Report_FontSize: 12
This is the default font size that will be applied at the opening of the component (with Host database or not). It is applied to the area of the report when you create and display a report, or when you open a report.
You can decrease the default font size down to size 10, and up to size 18.
As this default size is applied to all users of the component, you can overwrite this preference, by setting your own preferred size in the same key in your local file: “4DIR_General_Prefs.json”.
(Method aa4D_M_Show_Preferences to access this local file.)
For example, if you use the component in Stand-alone to analyse a folder of reports, and you are using a large screen, you can set this value size to 16 in your “4DIR_General_Prefs.json”.
All new Window displaying a report will use this default size.
As explained page 46, you can increase/decrease the default size for the session, via the “-” and “+” Buttons, or when the focus is inside the report area.
The last current size will be applied for all new window displaying a report until you quit 4D.
Array_profiler.json file (completed in v4.47 and v4.50):
(reminder, this file is replacing the historical text file Array_profiler.txt since v4.40)
{
Manufacturer: “ASUS”
Model_Identifier: “PRIME X299-A”
Memory: “65536”
System_version: “Windows Server 2019 Standard [1809] (17763.3650)”
Number_of_Processors: “1”
Processor_Name: “Intel Core i7-7820X”
CPU_Speed: “3.60 GHz”,
Total_Number_Of_Cores: “8”
Total_number_of_CPU_threads: “16”
System_Web_browser: “Microsoft Edge 107.0 (107.0.1418.56)”
Internal_build_4D: “19 R7 (100256)”
More_info_on_4D_release: «19 R7 Public release (January 9, 2023)»
Application_type: “4D Server” // <=== NEW in v4.47
Date_modified: “2023-01-05” // <=== NEW in v4.47
TLSEnabled: false
useLegacyNetworkLayer: false
volumeShadowCopyStatus: “Available”
headless: false,
Launched_As_Service: true
Other_4DServer_Run_as_Service: “Total: 15”
Product_version: “20230107_19R7 (100256)” // <=== Now a separate and renamed property.
File_Description: “(My_Server_Application)”, // <=== NEW in v4.47
Copyright: “(My_Copyright)” // <=== NEW in v4.47

This_file_creation_date: «2023-01-26», // <=== NEW in v4.50
Computer_started_since: «1 day, 7 hours, 25 minutes» // <=== NEW in v4.50
Application_started_since: «0 day, 0 hour, 0 minute» // <=== NEW in v4.50

«ProcessesInfoList»: [ // <=== NEW in v4.50 (v18/v19, use a variant for $1) // see note below
{
«name»: «SentinelAgent.exe»,
«pid»: 12728
}
{
«name»: «SentinelAgentWorker.exe»,
«pid»: 1328
}
]
}
If a file «ProcessesToListServer.txt» is in the “Resources” folder of the component, and contains “[SentinelAgent]” : When creating the first report, this method will search all processes with a name beginning with “SentinelAgent” in this example.
To prevent any execution of the method (as it might consume few seconds to execute), just let in this file the default content: “[STOP]”.
This collection will also be returned when calling the shared method: aa4D_M_RunningProcesses2Search, with or without argument.
See documentation of this new shared method aa4D_M_RunningProcesses2Search
Version 4.50
New shared method: aa4D_M_RunningProcesses2Search
aa4D_M_RunningProcesses2Search
| Parameter | Type | Description |
| A text string | Text | “msEdge” |
| Or | ||
| A collection | A string of collection | “[“Sentinel”, “Activity monitor”]” |
| Or | ||
| A pointer | Pointer to Array text | Mytext2Search{1}, Mytext2Search {12}, etc |
| Result | Parameter | Parameter |
| Content result | A string of collection | Answer with a collection of paired values: (name, pid) |
Description
The aa4D_M_RunningProcesses2Search search every process running on the computer whose name begins with each name listed as parameter:
If there is a file inside the Resources folder of the component named «ProcessesToListServer.txt»,
You don’t need to pass a parameter to search: the list will be inside the document, formatted as a collection.
If this file contains “[STOP]”, you prevent the use of this shared method. See example in previous section.
Version 4.40
* available for 4D v18, 4D v19 (->19R5) and another one for v19R6 (and later):
- Array_profiler.txt has been replaced by Array_profiler.json (easier to parse by code)
(in label names, “ ” are replaced by “_” to be able to address directly the content. - There is a new information section (above the Attention section):

- New Security Attentions: If still using macOS 12.5 (instead of 12.5.1 or later) with other macOS versions, if still using Safari 15.6 (update to Safari 15.6.1 or later) If Port HTTP allowed: HTTPS is more secured.
When the Web Server is started, both Ports HTTP and HTTPS are now listed (if allowed): Web: The Web Server is started (port HTTP: 8000) (port HTTPS: 443)
- Items attached in the backup are now listed
- [2009] has been removed from (recent) Windows 10 and Windows 11 description: deprecated
Version 4.30
New shared method: aa4D_M_Schedule_Reports_Info
aa4D_M_Schedule_Reports_Info
aa4D_M_Schedule_Reports_Info
| Result | Type | Description |
| DelayBetween | Real | Defined in minute(s) the delay between two reports |
Description
The aa4D_M_Schedule_Reports_Info returns the current value of the delay between the creation of reports in the Stored procedure:
- If the real value returned = 0 : the Stored procedure is not running (on the Server)
- If the real value returned > 0 : the Stored procedure is running (on the Server), with the value as minute(s). This value might be different than an integer value: 0.25 (or 0,25) equal 15 seconds
Version 4.20
Only available if run with 4D v19 or later, using the component for v19:
- New Attention if the application is run using Rosetta on a Silicon processor.
- New Attention if the Debugger is connected at Startup (if in interpreted mode)
Deployment of the component
To use the component, add it to the “Components” folder next to the Structure file of your application. (Create this folder “Components” if it does not exist).
This component does not create Table(s) in the Host database. The Host database remains unchanged. Only the folder “Folder_reports” is added next to the data file, and filled with created reports.
Accessing the code of the component from the Host database.
While in development, or if you allow access to the execution of methods, the shared methods of the components can be executed directly: They begins with “aa4D_”.
(you can also see them in the Explorer (project methods), after deploying the component list, and selecting this component)
If you plan to deploy your application, we recommend to avoid tokenizing the shared methods of the components in your Host database, in case you want to remove it, or later update to version 5 when it will be available.
You can use this example of code to avoid the “hard link” of the component with your Host database:
//—– to execute a shared method and be able to compile after removing the component —
ARRAY TEXT($at_Components;0)
COMPONENT LIST($at_Components)
If (Find in array ($at_Components;»4D_Info_Report@»)>0)
If (Shift down) // Only on demand
EXECUTE METHOD(«aa4D_M_Util_CreateReport») // Create one report
End if
You can also set a Boolean interprocess to avoid parsing the Component list each time, like <>vb_Is_4DIR_ready, and only test at startup if the component is available, and then use this alternative code:
If (<>vb_Is_4DIR_ready) // if the component 4D_Info_Report is loaded
If (Is compiled mode) // if the Host database is compiled
If (Application type=5) // 4D Server
EXECUTE METHOD(«aa4D_NP_Schedule_Reports_Server»;*;30;-2)
// or another shared method.
// EXECUTE METHOD(«aa4D_NP_Schedule_Reports_Server»;*;0) // to stop the stored procedure.
End if
End if
End if
Remind that all shared methods beginning with “aa4D_NP” create a new process, so you don’t need to create one in the Host database to execute these methods. Also, via some dialogs of the component, you can execute directly some other shared methods (if allowed).
You can limit the access of reports stored in the Server, or the right to set or change the setting of the stored procedure («aa4D_NP_Schedule_Reports_Server”) from a remote user, via this code to implement, as the component execute this shared Host method if it exists, and expect a True Boolean result:
// Host method: “aa4D_M_Host_Allow_Report_access” (example code)
C_BLOB($1)
C_BOOLEAN($0)
C_BLOB($vxBlob)
C_BOOLEAN($Allow)
C_LONGINT($Offset)
Allow:=True // default answer
If (Count parameters>=1)
If (Type($1)=Is BLOB )
vxBlob:=$1 //--- in Unicode only, as the component is built in Unicode ---»
ARRAY TEXT($at_infos;0)
Allow:=True // default answer
If (Count parameters>=1)
If (Type($1)=Is BLOB )
vxBlob:=$1 //--- in Unicode only, as the component is built in Unicode ---»
ARRAY TEXT($at_infos;0)
BLOB TO VARIABLE($vxBlob;$at_infos;$Offset)
//- $at_infos{1}:=Current user
//- $at_infos{2}:=(local) I.P. address
//- $at_infos{3}:=Current machine
//- $at_infos{4}:=Current machine owner
//- $at_infos{5}:=Calling component method (optional)
//

// --- set your own conditions, depending of the 5 array elements ---
$Allow:=False // default answer
If (Application type#4D Server )
// ALERT(aa4D_M_Host_Allow_Report_access' OK») // to control that it is called
End if
End if
End if
End if
End if
$0:=$ Allow
It is up to you to design the conditions test (for example limiting this access to local network users, such Current user, etc…)
To ease a better usage of the component, there is a small Host template database, that contains few methods to be added in your Host database(s).
In the «4D_Info_Report_Host_Template_v8_v17.4dbase», there is this HDI:
(content of the archive «4D_Info_Report_Host_T_v8_v17.zip»)
// Method: aa4D_M_Host__How_Do_I
// (Thomas.Schlumberger@4d.com, October 27, 2017)
//
// If you are using the Information component (4D_Info_Report_v4.9rC or later),
// Some specific Host methods will be tested by the component,
// If they exist and are shared, they will be used to communicate with the Host database.
//
// Note: if the component is removed, these methods will not disturb the behaviour of the Host database, so they can be integrated in your Host database without drawback.
//
// at least copy (by Drag and Drop) these seven methods in your Host database:
// - «aa4D_H__Startup» // to be called in the On Startup method
// - «aa4D_H_On_Server_Startup» // to be called in the On Server Startup method
// - «aa4D_Host_GetDBParam» (new shared method now usable with all versions of 4D).
// - «aa4D_M_Host_Manage_Info_Report»
// - «aa4D_M_Host_Attention_Reported»
// - «aa4D_M_Host_Allow_Report_access»
// - «aa4D_M_Host_SP_Scheduler» // Mandatory if using «aa4D_H_On_Server_Startup»
// - «aa4D_M_Host_Is_in_Unicode» (deprecated now, replaced by aa4D_Host_GetDBParam)
// - «aa4D_M_Host_Get_both_Timeout» (can use aa4D_Host_GetDBParam instead)
// You must keep their original name, and set «shared by component and host database»
// Reminder: to use the component «4D_Info_Report_v4»,
// just add it to the «Components» folder of the Host database or the 4D Application.
// (if this «Components» folder does not exist, just create it).
//
// As this database is compatible with 4D v17 database:
// To use these methods with a Host database that is running with 4D v17 or later versions,
// just convert a copy of this Template database with your current 4D version
// before drag & dropping these methods into the Host database. Note: To force a French content of the report, you can add an empty file named “French_interface” *
in the “Resources” folder of the component, the created reports with use French labels:

*(“French_interface”, “French_interface.txt”, “French_interface.rtf” tested in the Resources folder).
You can also create and copy such empty file in the preferences folder: “4D_Info_Report_Prefs”.
With this file installed, the reports will be created with French labels instead of English ones.
The component is able to parse reports with French or English labels.
(To access the folder “4D_Info_Report_Prefs”, use the new method “aa4D_M_Show_Preferences”):
This folder was already created with previous versions of the component when creating a report, and is located in your profile user:
On Windows: Startup Disk\(user name)\AppData\Roaming\(your 4D application)\4D_Info_Prefs
On macOS: Startup Disk:(user name):Library:Application Support:(your 4D application): 4D_Info_Prefs
This folder can already include previous internal preferences, VB scripts to help parsing the system.
After implementing these provided methods in your Host database:
- More information will be available in the created reports, such as the Unicode mode, the timeout values (4D Server, 4D Remote)
- When a new Attention is raised in a new report, the Attention content is received by the Host database, that can take appropriate action depending of the content changes.
- For some kind of actions performed via the component, you can disallow such actions depending of the profile of the remote user.
Note: The first report generated by the component after the startup of 4D or 4D Server will take a longer time to be created.
Until the database is opened again, following reports will be created much faster, because some deep parsing is already done and memorized.
Also, during the creation of the first report, a checking of the SQL syntax compliance for tables and fields will be performed (if the Host database is opened in Interpreted mode):
A file « Info_SQL_Naming.txt» can be created with the summary for tables and fields names that does not comply.
Some info on the component behavior:
When the stored procedure is started for creating reports on 4D Server, you will see these kinds of processes on the Server:

All created processes are named “4DIReport_…” so you can easily notice them.
“4DIReport_SP_Scheduler” is the name of the stored procedure created to generate the reports.
If there are more than 8 tables in your Host database, a worker is created to finish the creation of the reports (“4DIReport_W_CreatedReportFile”), if your database is compiled and using 64-bit.
If from a remote user to the Server, you check “Live update” in the compare dialog or the Graph dialog, you will be registered (“(“4DIReport_W_Update_(user name and IP) to receive the values of each new report created on the Server to complete your List box or SVG Graph.
With the component version for 4D v17 (not 64-bit only), you will be able to use it with a non Unicode mode Host database (not the recommended mode).
Updates of the component policy (modified in v4.60)
There is on average an update of the component every two months, that include new features, and recognition of new versions of 4D and 4D Server.
It is then important to check from time to time if an update of the component is available via the forums or source where it was downloaded. Also, it will be soon renamed “4D_Info_Report_v5”.
The version 5 of the component, when available, will NOT be compatible with 4D v17 or 4D v18 (no more supported since June 17, 2022).
The current version 4.60 is provided for 4D v18, 4D v19, 4D v20 and also for v19 R6 and later v19Rx.
We recommend to update the component when available, to get more updated information in reports.
Reminder of the current link to get the last current version of the component via the historic TAOW link
to get access to the documentation, and archives of the component (also for earlier versions of 4D):
https://taow.4d.com/Tool-4D-Info-Report/PS.1938271.en.html
Also, there are announcement of every update of the component in the Partners section of the forum (https://discuss.4d.com) with the Change list, when a new version is available:
https://discuss.4d.com/c/english-community/partners-worldwide/26
Support of Apple Silicon computers:
4D_Info_Report v4.60 (for v19, v19R6, v20 and later) has been tested and validated with the recent new generation of Apple computers that use the Mx processor.
It is up to you to use the recommended and updated version of macOS with 4D.
Three builds archives of the component for v19, for v19 R6 and v20 are provided:
- with the Silicon code not included: zip archive name with “_I_” (Intel)*
- (the component for v18 is also updated in v4.60)
- with the Silicon code also included: zip archive name with “_IS_” (Intel+Silicon)
Support of the v17 releases down to the v12 are available in the Archive section in TAOW.
(the last updated components for v17 is the v4.33, in the Archive section. The previous matching documentation is “4D_Info_Report_v4_30_Ref_v35.pdf”).
Conclusion
This component has already been widely used since more than ten years, even with heavily loaded 4D Server. We advise installing it in your 4D Server application, so you can monitor the Server or create a report for the Tech Support upon request without restarting your application.
You can review our Blog and YouTube channel for additional information and resources on SapphireOne ERP, CRM and Business Accounting software.